
Child Growth Percentile Chart: How to Read the 2017 Korean Charts
Contents
A growth percentile shows where your child would stand if you lined up 100 children of the same sex and age in months from smallest to largest. In Korea, the reference is the 2017 Korean growth charts from the Korea Disease Control and Prevention Agency (KDCA) and the Korean Pediatric Society. The 50th percentile is the median.
Say your child's infant health checkup report or pediatrician tells you, "Height is at the 30th percentile." That means your child is about 30th from the smallest in a group of 100 peers. This article explains how to read a percentile, the median values by month on the growth charts, and how percentiles are actually calculated.
Summary ① Percentile: Where a child ranks, counting from the smallest, among 100 children of the same sex and age in months. 50 is the median. ② Reference data: The 2017 Korean growth charts (WHO growth standards for 0–35 months, Korean data from 36 months). The next edition is scheduled for release at the end of December 2027. ③ How it's calculated: Use the L, M and S values in the growth chart data tables to get a z-score, then convert it to a percentile. ④ Calculator: Enter sex, age in months, height and weight to see height and weight percentiles, plus BMI percentile from 24 months. Results are for reference only and are not a diagnosis.
What does a growth percentile mean?
A percentile is a rank, not a score. A height percentile of 30 means your child is about 30th from the smallest among 100 peers. It does not mean "30% shorter than average."
- 50th percentile: The median for children of the same sex and age in months.
- Below the 3rd or above the 97th percentile: The value falls within the lowest 3 or highest 3 of 100 peers. If your child is in this range, or if their percentile changes a lot over a few months, it's a good idea to see a pediatrician.
- Weight percentile and obesity are not the same thing: Obesity is judged by BMI percentile for sex and age from 24 months, not by weight percentile (85 or higher is overweight, 95 or higher is obese).
The trend matters more than any single measurement. Even if a percentile is low, a child who keeps following a similar line at each visit is maintaining their own growth curve.
What are the 50th percentile (median) height and weight by month?
These are medians calculated from the 2017 growth chart data tables. Values in parentheses are the 3rd–97th percentile range.
| Age (months) | Boys' height (cm) | Boys' weight (kg) |
|---|---|---|
| 0 | 49.9 (46.3~53.4) | 3.3 (2.5~4.3) |
| 6 | 67.6 (63.6~71.7) | 7.9 (6.4~9.7) |
| 12 | 75.7 (71.3~80.2) | 9.6 (7.8~11.8) |
| 24 | 87.1 (81.4~92.9) | 12.2 (9.8~15.1) |
| 36 | 96.5 (89.7~104.4) | 14.7 (12.3~17.7) |
| 60 | 109.6 (101.6~118.0) | 19.0 (15.4~24.3) |
| Age (months) | Girls' height (cm) | Girls' weight (kg) |
|---|---|---|
| 0 | 49.1 (45.6~52.7) | 3.2 (2.4~4.2) |
| 6 | 65.7 (61.5~70.0) | 7.3 (5.8~9.2) |
| 12 | 74.0 (69.2~78.9) | 8.9 (7.1~11.3) |
| 24 | 85.7 (79.7~91.8) | 11.5 (9.2~14.6) |
| 36 | 95.4 (88.1~102.9) | 14.2 (11.7~17.0) |
| 60 | 108.4 (100.7~116.7) | 18.4 (14.9~23.7) |
Under 24 months, height is measured lying down (length). From 24 months, it's measured standing.
Free, no sign-up. Get height, weight and BMI percentiles based on the 2017 Korean growth charts.
How is a percentile calculated?
The growth chart data tables give three values for each sex and month: L (skewness), M (median) and S (spread). You use them to get a z-score, then convert it to a percentile.
- z = ((measurement ÷ M)^L − 1) ÷ (L × S)
- Convert z to a cumulative proportion on the standard normal distribution. That is the percentile.
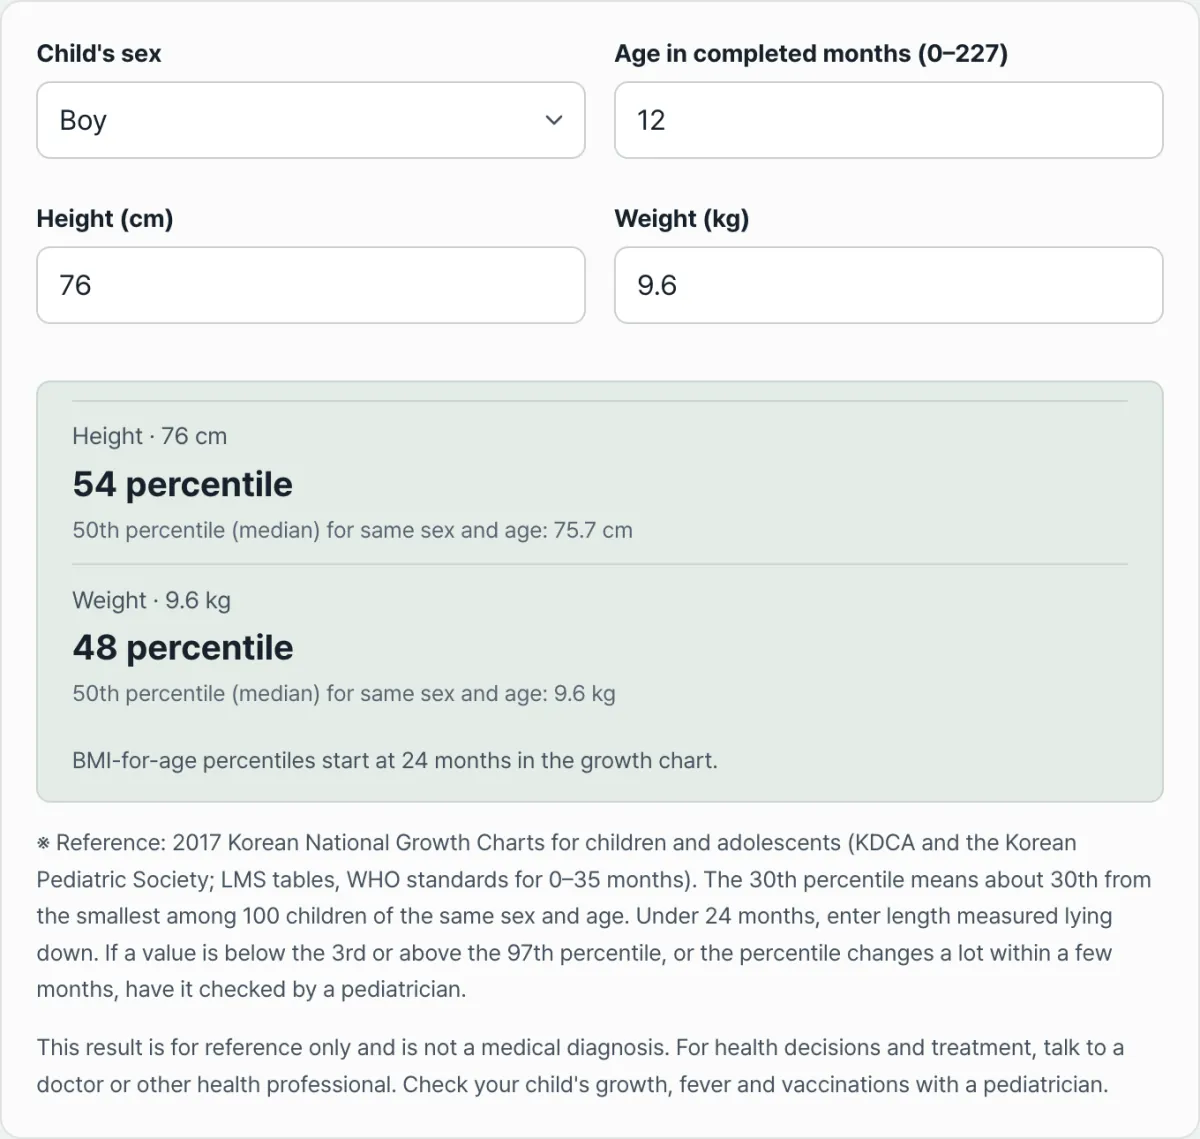
Example: a 12-month-old boy, 76 cm tall, 9.6 kg
- Median for boys of the same age: height 75.7 cm, weight 9.6 kg
- Height of 76 cm → about the 54th percentile
- Weight of 9.6 kg → about the 48th percentile
- Both are close to the median, so he's right in the middle of his peers.
The Child Growth Percentile Calculator uses the L, M and S values from the KDCA's published "Growth Chart Data Tables" exactly as given. When compared with the published tables for the 3rd, 5th, 10th, 50th, 90th, 95th and 97th percentiles, the results match to one decimal place. An earlier version of this calculator only connected average values at certain months and showed "% of average." That number is not a percentile, so we switched to the actual percentile calculation.
What can you check with the calculator?
Enter sex, age in completed months (0–227 months), height and weight, and you'll see the following on one screen.
- Height percentile and the 50th percentile height for the same age in months
- Weight percentile and the 50th percentile weight for the same age in months
- From 24 months, BMI and BMI percentile, plus a result of underweight, healthy weight, overweight or obese
Your entries are calculated only in your browser and are not saved.
Summary
- A percentile is a rank among 100 peers. 50 is the median.
- The Korean reference is the 2017 Korean growth charts. It stays in use until the 2027 growth charts are released.
- If your child is below the 3rd or above the 97th percentile, or if percentiles change a lot in a short time, check with a pediatrician.
- Calculation results are for reference only and are not a diagnosis.
Free, no sign-up. Get height, weight and BMI percentiles based on the 2017 Korean growth charts.
Frequently asked questions
What age should I enter for a premature baby?
For a baby born before the due date, you generally enter the corrected age based on the due date, not the birth date. How long to correct for depends on your baby's condition, so ask your pediatrician.
Is it a problem if my child's height and weight percentiles are far apart?
A tall, slim child may have a height percentile higher than the weight percentile. But if the gap keeps widening, or the weight percentile keeps dropping, it's a good idea to see a doctor.
Does a low percentile mean my child will be short?
You can't tell from a single percentile. What matters more is whether your child keeps growing along the same percentile line. Factors such as parents' heights also play a role.
Up to what age can I calculate percentiles?
The calculator covers 0–227 months (18 years 11 months), the range that has growth chart data. BMI percentile is available from 24 months.
Is the child information I enter saved?
No. Calculations happen only in your browser. Nothing is sent to a server or saved.
Sources
- KDCA Korean growth charts website: "2017 Korean Children and Adolescents Growth Charts: Basic Data and Growth Chart Data Tables" https://knhanes.kdca.go.kr/knhanes/grtcht/main.do (accessed 2026-11-17)
- National Cancer Information Center, "Childhood and Adolescent Obesity": BMI percentile classification ranges https://www.cancer.go.kr/lay1/S1T800C802/contents.do (accessed 2026-11-17)
This article was adapted from our Korean original. Read the Korean original