
Percentile Rank Formula: How to Calculate It by Hand
Contents
Percentile and rank are different ideas. Rank counts position — first, second, third. Percentile calculates what percentage of the whole is lower than your value.
This post walks through what the standard percentile formula (L + 0.5×E) / N × 100 actually counts, using a numeric example you can work out by hand step by step.
Summary ① A percentile isn't a rank — it's the share of values below yours. The formula is (L + 0.5×E) / N × 100. ② Ties (E) get only half weight, so they're not counted entirely as lower values or entirely as higher ones. ③ The "at or below" version (L+E)/N and the "below" version L/N give different numbers from the same data, so check which definition was used when you look at a result.
The confusion that comes from mixing up percentile and rank
Say you placed 3rd in a company certification exam that 10 people took. Many people figure, "3rd place, so I'm around the top 30%." But that calculation just divides your rank by the number of people, and it gives a different result from the percentile method.
Rank is an ordinal number that counts which position you're in. A percentile counts what percentage of the whole scored lower than you. When there are ties, the two drift far apart.
For example, if 3 of 10 people got exactly the same score, it's already unclear what rank to call each of those 3. The percentile method, by contrast, has a built-in way to handle ties inside the formula, so you still get a single number in that situation.
How to calculate it by hand without a tool
The standard percentile formula is:
PR = (L + 0.5 × E) / N × 100
- L (Less): the number of data points smaller than the target value
- E (Equal): the number of data points exactly equal to the target value (including yourself)
- N: the total number of data points, where N = L + E + G (G is the number of data points greater than the target value)
Let's run the numbers. Suppose you have the 10 scores below and your score is 75. Original data: 60, 95, 75, 55, 80, 75, 68, 88, 72, 75
Step 1: Sort in ascending order
Sorted: 55, 60, 68, 72, 75, 75, 75, 80, 88, 95 The total count is N = 10.
Step 2: Split into three groups around the target value (75)
- L (below): 55, 60, 68, 72 → 4
- E (equal): 75, 75, 75 → 3
- G (above): 80, 88, 95 → 3
Check: L + E + G = 4 + 3 + 3 = 10, which matches N.
Step 3: Plug into the standard formula
PR = (4 + 0.5 × 3) / 10 × 100 = 5.5 / 10 × 100 = 55%
Why add only half for the 3 tied scores? If you count every tie as "lower than me," your result comes out more generous than it really is. If you count none of them, it comes out harsher. The standard formula splits ties exactly in half and computes the midpoint.
Step 4: Compare with other definitions
Putting the same data into other formulas gives other numbers.
- At or below: (L + E) / N × 100 = 7 / 10 × 100 = 70%
- Below only: L / N × 100 = 4 / 10 × 100 = 40%
- Standard percentile: 55%
Same score of 75, same data, yet the definition gives you three different numbers: 40%, 55%, and 70%. When you see an already-calculated result like "84th percentile," you have to know which of the three definitions was used to read it correctly.
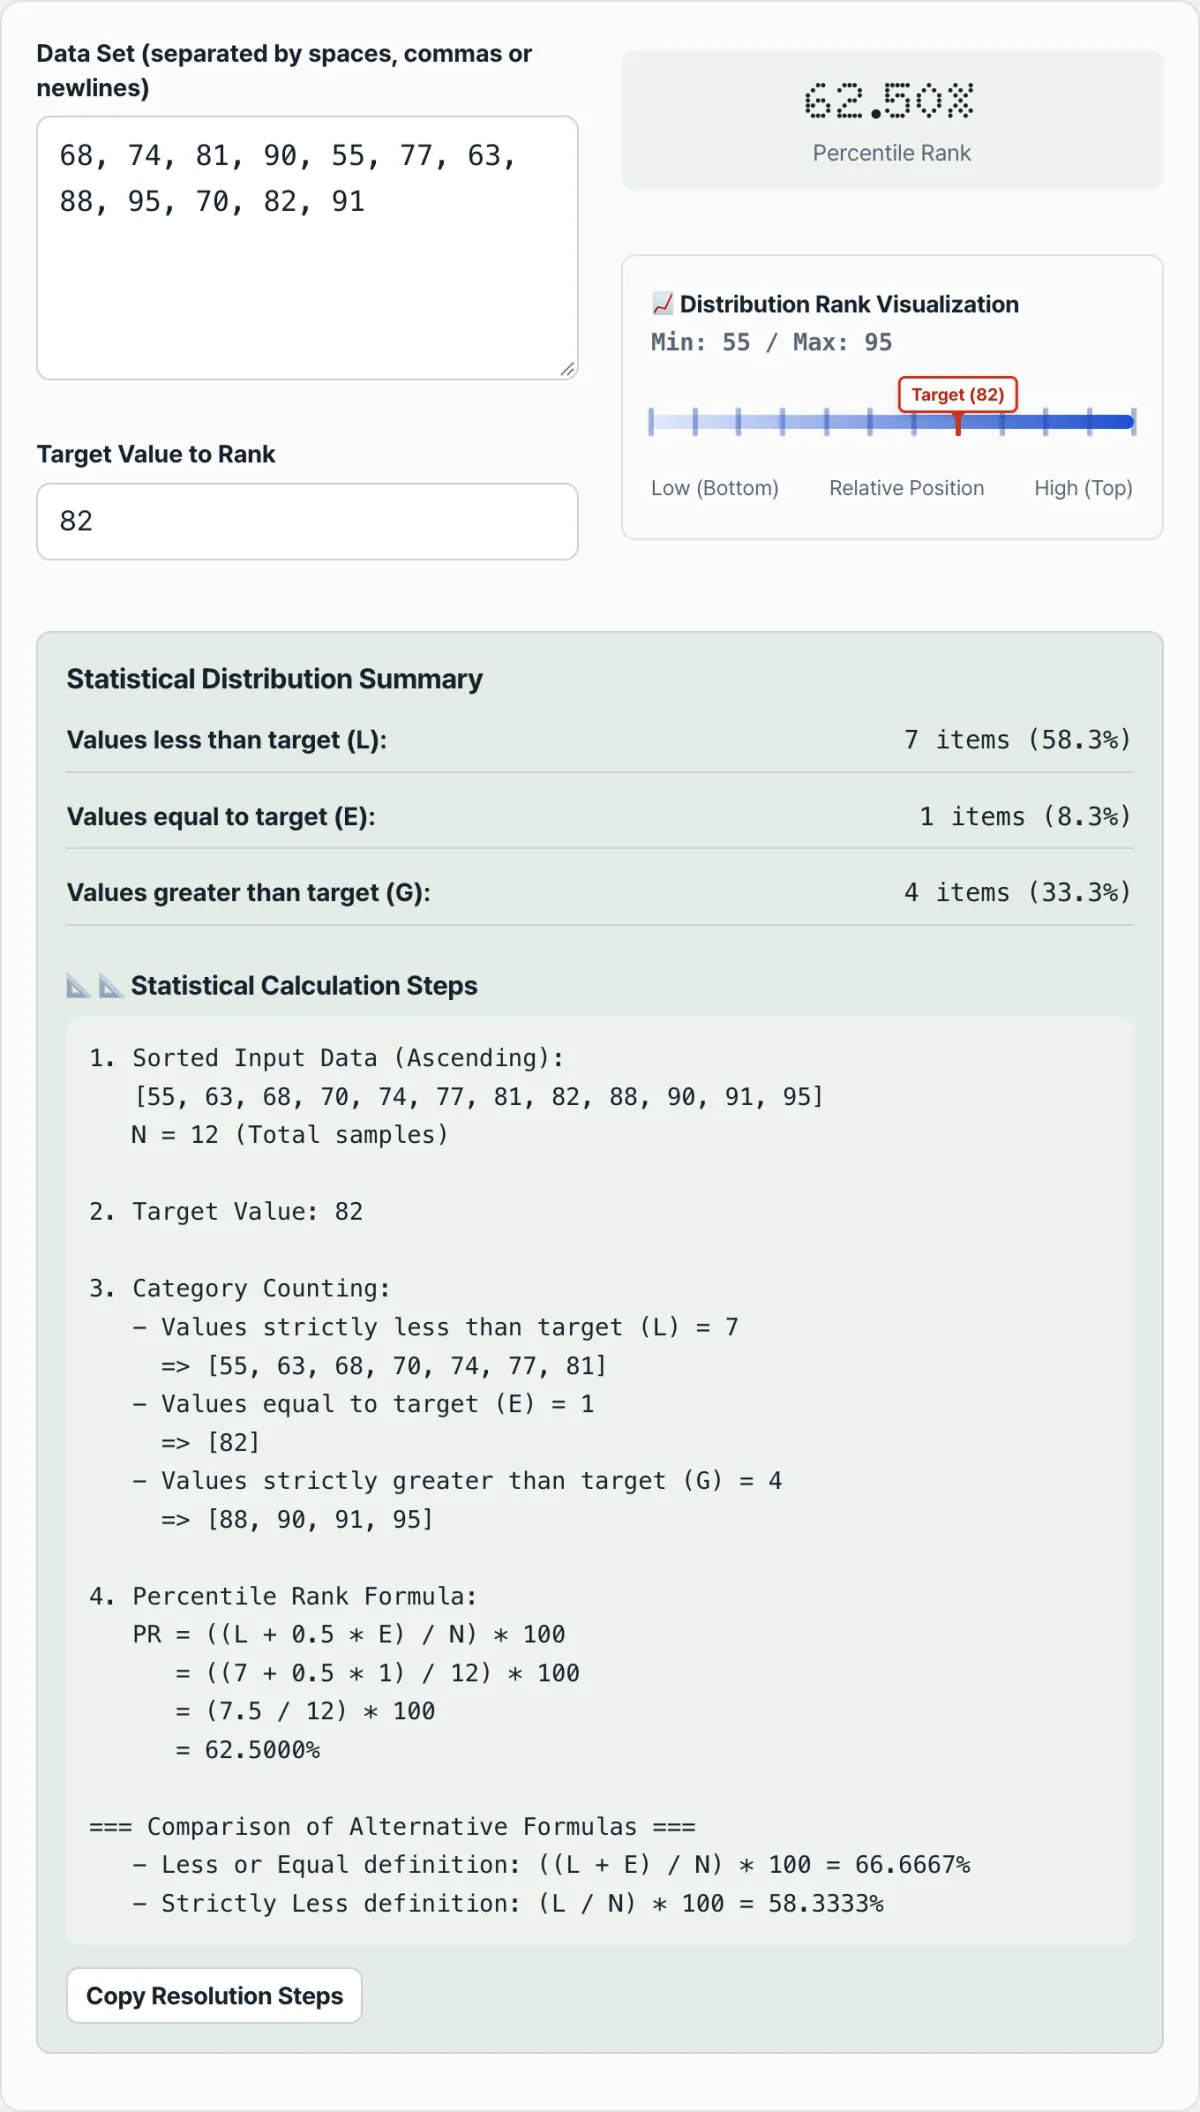
Doing this by hand means sorting the numbers and splitting them into three groups every single time. There's a tool that takes your data and target value and shows you the sorting, the grouping, and all three definitions at once, with no extra buttons to press.
Check it all at once with a calculator
Check it with our tool.
Enter your data and a target value to get the standard percentile rank plus the at-or-below and below cutoffs, with no sign-up.
The result screen shows all three percentile figures along with a distribution bar that marks where the target value sits on the sorted data, plus a step-by-step breakdown you can copy as-is.
Common misconceptions and mistakes
Here are a few misconceptions that come up often when people talk about percentiles.
"Your rank divided by the number of people is your percentile." — No. Rank is position and a percentile is the share of values below yours, so once ties are in play the two calculations diverge.
"The 84th percentile means you're in the top 84%." — It's the opposite. Under the standard definition, a percentile counts up from the bottom, so the 84th percentile means 84% of values are below yours, which puts you around the top 16%.
"You can ignore ties and it won't make much difference." — The more ties in your data, the bigger the gap between the at-or-below, below-only, and standard definitions. As in the example above, it can stretch past 30 percentage points.
Comparing results by definition
Here's how the three definitions compare in a table.
| Definition | Formula | How ties (E) are handled | Result in the example above |
|---|---|---|---|
| Standard percentile | (L + 0.5E) / N × 100 | Counted at half weight | 55% |
| At or below | (L + E) / N × 100 | All counted as lower than you | 70% |
| Below only | L / N × 100 | Not counted at all | 40% |
All three definitions are genuinely used in practice. It's not so much about which one is right or wrong — what matters is checking which definition your data source or tool uses.
Recap
- A percentile isn't a rank; it counts the share of values below yours.
- The standard formula is (L + 0.5E) / N × 100, where L is the count below, E is the count of ties, and N is the total count.
- Ties get only half weight (0.5E), which puts the result at the midpoint between the at-or-below and below-only versions.
- The same data gives different numbers depending on the definition (standard, at or below, below only), so check which one you're looking at.
- If doing it by hand is a hassle, enter your data and target value into the calculator and compare all three definitions at once.
Enter your data and a target value to get the standard percentile rank plus the at-or-below and below cutoffs, with no sign-up.
Frequently asked questions
What happens if several people have exactly the same score as me?
Use the standard formula (L + 0.5E) / N × 100, which gives the tied group (E) only half weight. If you counted every tie as lower than you, you'd get the at-or-below version (a higher number); if you counted none of them, you'd get the below-only version (a lower number).
The standard formula computes the value in between.
Can I calculate a percentile if my score isn't actually in the data list?
Yes. Even when the target value doesn't appear in the data, you can count L and G based on where it would fall in the sorted data. In that case nothing exactly equals the target value, so E is 0, and the percentile is calculated from L and G alone.
Does a higher percentile number mean a better ranking?
Going by the formula alone, a higher percentile means more values are below yours. If higher scores are better in your data, then a higher percentile means you're relatively higher up.
That said, some fields define it in the opposite direction, so it's worth checking the calculation basis when you look at a result.
When is the "at or below" version used versus the "below only" version?
Both definitions are genuinely used in statistics. The at-or-below version, (L+E)/N×100, counts all ties as equal to or lower than you, while the below-only version, L/N×100, doesn't count ties at all.
The same data gives different numbers depending on the definition, so looking at all three values together shows you where the standard formula lands in between.
This article was adapted from our Korean original. Read the Korean original