
SVG Circular Progress Bar: Circumference and offset formula
Contents
- Why a Circular Progress Bar Requires Math
- Calculating SVG Circumference and Building It with CSS
- stroke-dashoffset Values by Progress, Plus Design Tips
- Reference Table of Radius and Circumference by Common Size
- Wrapping Up
- Core Technical Mechanics: How an SVG Circular Progress Bar Works
- Side-by-Side Comparison: Circular Progress Implementation Matrix
- 5 Common Mistakes When Building a Circular Progress Bar
- The 5-step workflow for a flawless SVG circular progress bar
- 7 tips for SVG circular progress bars
- Decision tree for choosing a rendering technique
- Terminology cheatsheet
- Frequently asked questions
To show a progress percentage on a circular gauge in a dashboard stat card or a file upload wait screen, you can't just change the width like you would on a rectangular bar. You have to calculate the circumference of the SVG circle and feed it into stroke-dasharray and stroke-dashoffset so the ring appears filled to the amount you want. Every time the size (diameter), stroke width, or target percentage changes, you have to start over from the radius and repeat the math by hand. Knowing the principle lets you verify for yourself why the values come out the way they do.
Summary ① A circular progress bar declares the circle's circumference as
stroke-dasharray, then hides the remaining span withstroke-dashoffsetto express progress. ② With a size (diameter) of 120px, stroke width of 8px, and progress of 75%, the radius is 56px, the circumference is ≈ 351.86px, andstroke-dashoffsetis ≈ 87.96px. ③ You can skip the math entirely and just adjust the circle size, thickness, colors, and progress to get the SVG and CSS code directly.
Why a Circular Progress Bar Requires Math
A regular rectangular progress bar only needs its filled portion's width changed to a percentage, but a circular bar doesn't work that way. An SVG <circle> element can draw its border (stroke) as a solid line, or it can use stroke-dasharray to break it into a dashed line. If you match that dash gap to the full circumference of the circle, you can express progress as "how far the line is drawn and where it goes empty." So to build a circular gauge, you first need to know the circumference of the circle, and then calculate how much to hide for a given progress.
Calculating SVG Circumference and Building It with CSS
The calculation takes two steps.
- Radius (r) = (size (diameter) − stroke width) ÷ 2
- Circumference (C) = 2 × pi (π) × radius (r)
- stroke-dashoffset = circumference (C) × (1 − progress (P) ÷ 100)
Take a size (diameter) of 120px, stroke width of 8px, and a target progress of 75% as an example:
- Radius: (120 − 8) ÷ 2 = 56px (the stroke is drawn along the circle's center line, so it sits half the stroke width inward)
- Circumference: 2 × 3.14159 × 56 ≈ 351.86px
- stroke-dasharray: 351.86 (declare the full circumference as-is)
- stroke-dashoffset: 351.86 × (1 − 0.75) ≈ 87.96px (hide the remaining 25%)
Here is the markup and CSS for a circular progress bar at 75% progress.
<div class="progress-circle-container">
  <svg class="progress-ring" width="120" height="120">
    <!-- Background circle track -->
    <circle class="progress-ring-bg" stroke="#e2e8f0" stroke-width="8" fill="transparent" r="56" cx="60" cy="60" />
    <!-- Progress circle track -->
    <circle class="progress-ring-bar" stroke="#3b82f6" stroke-width="8" stroke-linecap="round" fill="transparent" r="56" cx="60" cy="60" />
  </svg>
  <span class="progress-text">75%</span>
</div>
.progress-ring { transform: rotate(-90deg); /* Rotate the start point so it fills from 12 o'clock */ }
.progress-ring-bar { stroke-dasharray: 351.86; stroke-dashoffset: 87.96; /* 75% progress state / transition: stroke-dashoffset 0.8s ease-in-out; / Smoothly animates when the percentage value changes */ }
Note You don't have to punch pi and the radius into a calculator to get the
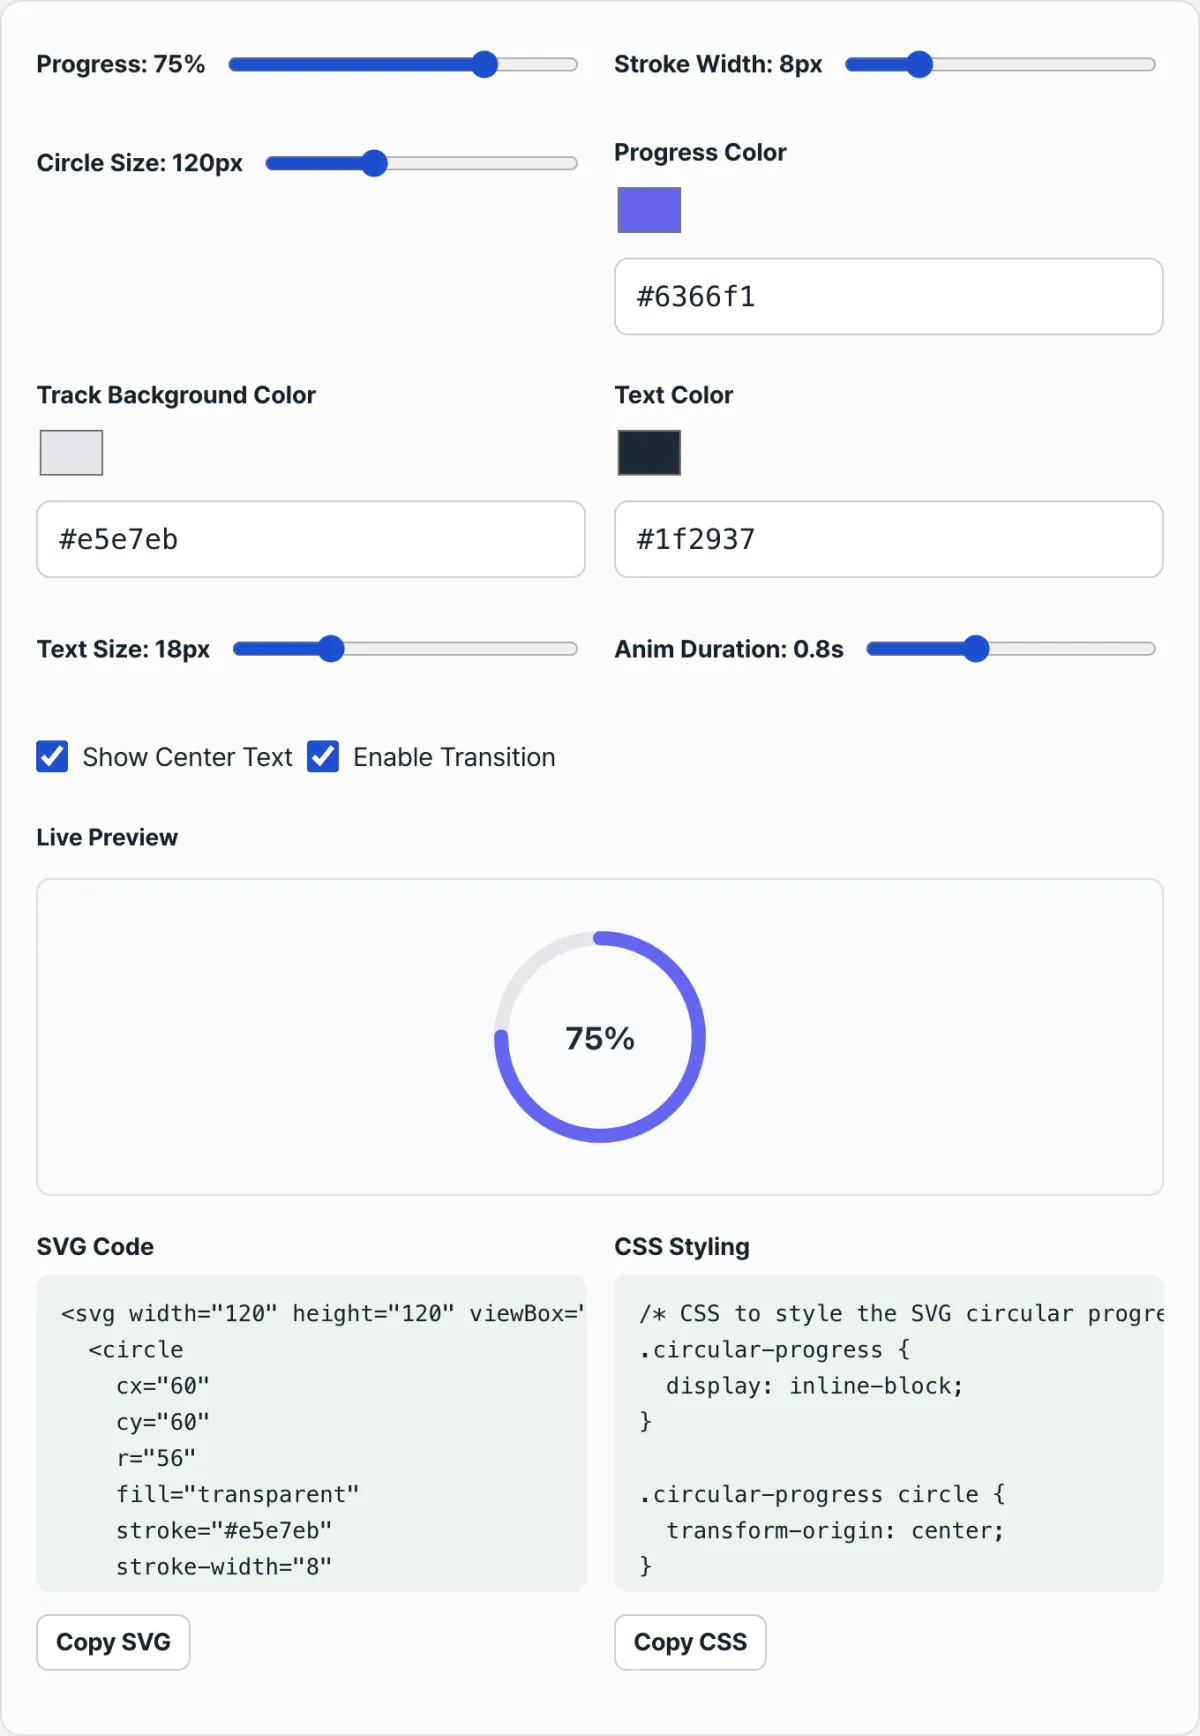
stroke-dashoffsetin pixels each time. You can adjust the circle's size, thickness, colors, and progress (%) with sliders and copy the SVG and CSS code as-is.
If you'd rather not do the math and hand-edit code, but want to change only the progress and styles and see the result right away, check it with our tool.
Set the progress percent, circle size (diameter), gauge thickness, and colors to get optimized SVG and CSS circular chart code right away.
stroke-dashoffset Values by Progress, Plus Design Tips
Based on a size (diameter) of 120px and stroke width of 8px (radius 56px, circumference ≈ 351.86px), here are the stroke-dashoffset values for each progress level.
| Progress | stroke-dashoffset |
|---|---|
| 25% | 263.89px |
| 50% | 175.93px |
| 75% | 87.96px |
| 100% | 0px |
Two things to keep in mind when applying the design.
- Turn the start point to 12 o'clock: An SVG
<circle>starts at 3 o'clock by default. To fill clockwise from 12 o'clock, settransform: rotate(-90deg)on the SVG element. - Round the ends: Add
stroke-linecap: roundto round both ends of the progress gauge. It gives a softer impression, like an infographic.
Reference Table of Radius and Circumference by Common Size
From small circles like badges to large dashboard cards, when the size (diameter) and stroke width combination changes, the radius and circumference change with it. Plug values into the radius = (diameter − stroke width) ÷ 2 formula ahead of time, and you can look them up in the table below instead of recalculating for every screen size.
| Size (diameter) | Stroke width | Radius | Circumference |
|---|---|---|---|
| 80px | 6px | 37px | ≈232.48px |
| 120px | 8px | 56px | ≈351.86px |
| 160px | 10px | 75px | ≈471.24px |
| 200px | 12px | 94px | ≈590.62px |
Note that for the same progress, a bigger size means a longer circumference, so the stroke-dashoffset value grows too. For example, at 75% progress with a 200px size and 12px stroke width, stroke-dashoffset is 590.62 × 0.25 ≈ 147.65px.
Wrapping Up
- A circular progress bar expresses the circumference (C = 2 × π × r) with
stroke-dasharray, and the remaining span withstroke-dashoffset. - The radius (r) is half of the size (diameter) minus the stroke width, and you can get the value for any percentage with the formula stroke-dashoffset = circumference × (1 − progress ÷ 100).
- Rotating the start point (
rotate(-90deg)) and handling the ends (stroke-linecap: round) affect how polished the design looks. - If the size, stroke width, or progress changes often, it's faster to grab the SVG and CSS code from a tool instead of calculating by hand.
Set the progress percent, circle size (diameter), gauge thickness, and colors to get optimized SVG and CSS circular chart code right away.
Core Technical Mechanics: How an SVG Circular Progress Bar Works
Let's dig into the deep mechanics of how an SVG circular progress bar is calculated mathematically and how it renders so smoothly on screen. This goes beyond copy-pasting code — you need to understand exactly how the browser draws that circle before you can build anything complex on top of it.
1. Stroke Geometry and the Radius Formula for SVG Circles
The canvas in SVG is the viewport and the viewBox. Take a coordinate system built on a D x D space (120 x 120px), for example.
In SVG, a stroke always extends outward from the centerline of the path it's drawn on. So if the stroke width is 8px, 4px of it sits inside the path and the other 4px sits outside.
That means if you want a full circle that isn't clipped by the edge of the viewport, and you want the diameter to be 120px, the radius you actually code has to be half of that — 60px — minus half the stroke width (4px).
- True Radius Formula: r = D − StrokeWidth/2 = 120 − 8/2 = 56px
With that radius, you calculate the total length around the circle. The circumference comes from the most basic formula in geometry.
- True Circumference Formula: C = 2π r = 2 × 3.1415926535... × 56 ≈ 351.858377px
This number (about 351.86) becomes the key reference point for controlling progress from here on.
2. The Masking Physics of CSS Dash Offset
The dash feature on SVG strokes is what turns a solid line into a progress bar. The trick is to make the dash length exactly match the full circumference.
- stroke-dasharray: C C; This property sets the "drawn length" and the "gap length." Put C (351.86) in both, and you get one long dash that wraps the circle exactly once.
- stroke-dashoffset: C × (1 − Progress/100)
This property pushes the starting point of the dash (the offset). Physically, it works like pulling a cover across the line.
- At 0% progress: Offset = C (351.86px). The dash is pushed back by the full circumference, so all you see is an empty track.
- At 50% progress: Offset = 0.5C (175.93px). Half is pushed back, so half the circle fills in.
- At 100% progress: Offset = 0px. Nothing is pushed back, so the dash runs the whole way around and you get a perfectly closed circle.
3. Coordinate System Rotation
In SVG's default trigonometric coordinate system, 0 radians — angle 0 — starts at 3 o'clock (right side, x=r, y=0). But the progress bars and clocks we see every day usually start at 12 o'clock (top) and fill clockwise.
To get that intuitive UI, you rotate the rendered SVG element 90 degrees counterclockwise.
- transform: rotate(-90deg); You also have to set the pivot so the rotation happens around the exact center of the circle, using transform-origin: 50% 50%; or a reference point like rotate(-90deg 60 60). Leave that out and the circle swings off on a wild arc and flies out of the viewport.
Side-by-Side Comparison: Circular Progress Implementation Matrix
There are plenty of ways to draw a circular progress gauge on the web. Compare the traits and trade-offs of each so you can pick the best fit for your project.
| Comparison | Pure SVG + stroke-dashoffset (recommended) | CSS conic-gradient() + mask | HTML5 Canvas arc() | Animated GIF / Lottie | WebGL shader |
|---|---|---|---|---|---|
| Vector scaling sharpness | Infinite scaling (perfectly crisp) | Varies with browser rendering | High-DPI (Retina) handling needed separately | Pixelated when scaled up, or file size balloons | Very crisp (but overkill) |
| CSS animation (transition) support | Full support (smooth and simple) | Partial support (needs newer specs such as @property) | None (you hand-code JS with requestAnimationFrame) | Depends on a Lottie player | None (needs a JS render loop) |
| Initial load bundle and file size | Lightest (under about 1KB) | Lightest | Moderate (needs canvas control logic) | Very heavy (hundreds of KB to MB) | Heavy (a library such as Three.js) |
| Implementation difficulty and maintenance | Easy (just know the math) | Very easy | Somewhat complex | Heavy reliance on designers | Very hard |
| Cross-browser compatibility | Full support in every browser | Limited in older browsers | Good | Tied to the library | Causes heat on low-end devices |
Summary: The most widely used and the biggest performance win is hands down the pure SVG approach. The file size is feather-light, it pairs beautifully with CSS animations, and it stays crisp pixel for pixel on any screen.
5 Common Mistakes When Building a Circular Progress Bar
Plenty of front-end developers make these costly slip-ups with circular charts without even noticing. Check these five and you'll cut your debugging time dramatically.
- Calculating the radius without accounting for stroke width (clipping bug): The mistake here is dividing the full diameter by 2 and stopping there, without subtracting half the stroke-width. The edge spills outside the viewBox, so the top, bottom, left, and right of the circle look flattened and cut off. Never forget r = (D − S)/2.
- Forgetting transform-origin when rotating: This is when you apply rotate(-90deg) to move the SVG element to the 12 o'clock start and leave out transform-origin: center; (or 50% 50%). The circle loses its center of rotation and vanishes toward the top-left of the screen.
- Leaving the ends rough (missing stroke-linecap): Skip stroke-linecap: round; and the two ends of the progress bar come out blunt and squared off, like a chopped stick. It's the main thing that drags down the polish of your design, especially at low progress values.
- Errors from an imprecise value of pi: If you calculate π as just 3.14, the circumference pixel value is slightly off. The result is a tiny gap even at 100% progress, so the stroke never quite closes. Use JavaScript's Math.PI, or at least 4 decimal places (3.1416) or more.
- Choppy animation from skipping the will-change property: On complex dashboards or real-time monitoring systems where data changes constantly, if you don't optimize your CSS animation with will-change: stroke-dashoffset;, the browser's rendering engine gets overloaded and the animation stutters.
The 5-step workflow for a flawless SVG circular progress bar
Here's a step-by-step guide to designing the component as reliably and accurately as possible.
- Step 1: Lock in the SVG canvas size and stroke width Decide on the overall size the component takes up on screen (D) and the width of the line you'll draw (S). Example: D = 120px, S = 8px.
- Step 2: Derive the true radius (r) mathematically To keep the stroke from getting clipped inside the viewBox, calculate r = (D − S)/2. Example: (120 − 8)/2 = 56.
- Step 3: Calculate the circumference (C, the total perimeter length) and assign it to a variable Get the circumference with the formula C = 2 × π × r. Example: 2 × 3.14159 × 56 = 351.86. Store that value in a CSS or JS variable (a CSS custom property).
- Step 4: Place the background track and the foreground (progress) circle Use two <circle> tags — one as a faint gray background line, the other as the progress line in your brand color. Give both the r, cx, and cy attributes you calculated earlier.
- Step 5: Add the CSS transition and the dynamic dash offset formula Set stroke-dasharray: 351.86; on the foreground <circle>, then update the stroke-dashoffset property dynamically based on the percent (P) value passed in through your JavaScript framework (React, Vue, etc.). Add transition: stroke-dashoffset 0.6s ease-out; to finish the animation.
7 tips for SVG circular progress bars
Seven advanced tips that go past a basic implementation and push the user experience (UX) as far as it can go.
- Modern, soft line caps: To keep the design from looking blocky and crude, always include stroke-linecap="round". It preserves the polished feel that circular designs are known for.
- Multi-stop gradients: Instead of a solid line, define a <linearGradient> or <radialGradient> inside <defs>, then apply it as stroke="url(#myGradient)" to build a gauge that feels alive.
- Use centered text anchors: When you show the progress percentage with a <text> tag, add dominant-baseline="central" and text-anchor="middle" and x="50%" y="50%" alone gives you perfect horizontal and vertical centering.
- Guarantee rotation in place, no drift: So the element doesn't wander during rotation animations, set transform-origin: 50% 50%; or use the SVG attribute transform="rotate(-90 cx cy)" directly instead of CSS.
- Build a semi-circular speedometer gauge: If you want a 180-degree half-circle gauge like a car speedometer instead of a full 360-degree circle, limit stroke-dasharray to half the circumference (0.5C) and adjust the rotation angle of the start point. That's all it takes.
- Smooth high-frequency data updates: When data changes several times a second — stock quotes, sensor monitoring, and so on — use linear instead of a normal easing function like ease-out. Pairing it with D3.js interpolation makes the screen much smoother.
- Lean on a boilerplate code generator: You don't need to retype all these formulas every time you change the size or thickness. The smart move in production is to grab finished code from the generator tool at the top of this page.
Decision tree for choosing a rendering technique
See at a glance when to use SVG and when to reach for something else.
- Q: Do the border lines need to stay perfectly smooth when the screen is zoomed in or out?
- No ➔ Consider Canvas or WebGL.
- Yes ➔ Go to 2.
- Q: Do you need an animation where the progress fills in smoothly according to the percentage (%)?
- No ➔ Pure CSS conic-gradient() is the simplest option.
- Yes ➔ Go to 3.
- Q: Do you want to combine it with frameworks like React or Vue and keep bundle size to a minimum?
- No ➔ Use a Lottie animation or a third-party library.
- Yes ➔ Answer: the SVG + stroke-dashoffset technique (the perfect fit)
Working through this decision tree, you'll land on the same conclusion for most modern web UI: the math-based SVG approach is the right answer.
Terminology cheatsheet
A quick rundown of the essential terms for web visualization. Use it so you're never confused in code reviews or when talking with teammates.
- Circumference: The total length of a circle's edge. The formula is 2 × π × r. You base the line length on this value.
- stroke-dasharray: The property that turns an SVG line into a dashed line. Set it equal to the circumference and you get one giant dash.
- stroke-dashoffset: Determines how far to push the start of the dash pattern. At 0% progress you push it by the full circumference; at 100% you set it to 0.
- stroke-linecap: round: Renders the start and end of a line as soft rounded curves instead of square right angles.
- viewBox: Sets the logical canvas ratio and coordinate system that graphics are drawn in inside the SVG. Anything outside it gets clipped and isn't visible.
- Vector scaling: Because the image is drawn with math instead of a collection of pixels, it never breaks down no matter how far you zoom in.
Frequently asked questions
Three deeper questions that go past simple usage and get at the heart of the technique, with clear answers.
Q1. Why do I have to subtract half the stroke-width from half the canvas diameter when calculating the SVG radius (r)?
A1. When the browser's SVG rendering engine draws a stroke, it spreads it by exactly the same width on both sides of the invisible center path. If the stroke width is 20px, 10px is drawn inside the center path and 10px outside it. If you make the radius fit exactly to the edge of the canvas, that outer 10px of stroke gets pushed past the SVG canvas (viewBox) boundary and is cut off instead of showing on screen. To prevent that, you push the center path itself inward by half the stroke width so the entire stroke stays inside the safe area.
Q2. How do I apply a rich multi-color gradient to an SVG circular track instead of a solid color?
A2. You can't control the color of a line inside SVG with the regular CSS background-image property. Instead, declare a <defs> element near the top of the SVG markup and create a <linearGradient> or <radialGradient> tag inside it. Define the color stops inside, like <stop offset="0%" stop-color="red" />, then give the gradient element an id (for example, id="myGrad"). Finally, on the <circle>'s stroke attribute, reference the gradient's id with stroke="url(#myGrad)" and you get a gradient that flows smoothly along the line.
Q3. What's the fundamental difference between a circular chart drawn with the pure CSS conic-gradient() function and the SVG-based approach?
A3. CSS conic-gradient() paints an element's background in a cone shape, like slices of a pizza. The code is extremely short and easy to implement, but it has a serious drawback: adding a CSS transition (animation) that fills in smoothly and naturally as the progress changes is very tricky. (You can do it with the newer @property spec, but support in older browsers drops off.) The SVG stroke-dashoffset technique, by contrast, gives you overwhelmingly smooth 60fps animation by default in nearly every browser, and rounding the ends of the stroke is far easier to pull off. For dynamic, beautiful UI, the SVG approach always wins.
;
This article was adapted from our Korean original. Read the Korean original