
Standard Deviation Calculator: Why Mean and Median Differ
Contents
Even with the same list of numbers, the mean, median, and mode come out differently because they're calculated in different ways. The standard deviation also changes depending on whether you divide by n or n−1. If you've ever gotten confused by these differences while sorting out grades, survey responses, or experiment data, this post walks through the calculation step by step and shows why the differences happen.
Summary ① The mean is the total divided by the count, the median is the middle value after sorting, and the mode is the value that appears most often — the methods themselves differ, so even the same data gives different results. ② Variance is the sum of the squared differences (deviations) between each value and the mean, divided by a count, and standard deviation is the square root of that variance. ③ Depending on whether you divide the sum of squared deviations by n (population) or n−1 (sample), the variance and standard deviation change, and the n−1 version is always greater than or equal to the n version.
When the Mean Alone Misleads You
Say you put together the commute times of six people on a team and shared, "Average commute time: 33 minutes." Most of the team comes back with, "Mine is way shorter than that, though."
The actual data is 15, 20, 20, 25, 30, 90 (minutes). Five of the six people are under 30 minutes, and only one person takes 90 minutes.
The mean is pulled way up to 33.3 minutes by that single 90, while the median (the middle value after sorting) and the mode (the value that appears most often) aren't affected the same way. Unless you see how the three values are calculated differently, that one number — "average 33 minutes" — won't tell you what commuting is really like for this team.
Doing the Math by Hand, Step by Step
If you work through the data above — 15, 20, 20, 25, 30, 90 (minutes) — all the way by hand, you go through the steps below.
Finding the Mean, Median, and Mode (Steps 1–3)
Step 1 — Count, total, mean. The count is 6, and the total is 15+20+20+25+30+90 = 200. The mean is the total divided by the count: 200 ÷ 6 ≈ 33.33 minutes.
Step 2 — Sort, then find the median. Sorted from smallest to largest, the values are 15, 20, 20, 25, 30, 90. Since the count is 6 (even), the median is the average of the two middle values (the 3rd value, 20, and the 4th value, 25): (20+25) ÷ 2 = 22.5 minutes. If the count were odd, the single middle value would be the median.
Step 3 — Count frequencies, then find the mode. Counting how many times each value appears, 20 shows up twice, more than any other value, so the mode is 20 minutes. If every value appears only once, the mode is treated as "none."
Finding the Deviations and Variance (Steps 4–5)
Step 4 — Deviations and the sum of squared deviations. Subtracting the mean (33.33) from each value gives deviations of -18.33, -13.33, -13.33, -8.33, -3.33, and 56.67. Squaring each and adding them up gives a sum of squared deviations of about 3983.5.
Step 5 — Variance. The variance depends on what you divide the sum of squared deviations by. If you treat these six values as the whole thing (the population), you divide by the count, 6. If you treat them as a subset (a sample) drawn from something larger, you divide by 6 minus 1, which is 5.
Dividing by n (6) gives 3983.5 ÷ 6 ≈ 663.9, and dividing by n−1 (5) gives 3983.5 ÷ 5 ≈ 796.7. The variance on the n−1 side, where you divide by the smaller number, is always greater than or equal to the other.
Finding the Standard Deviation (Step 6)
Step 6 — Standard deviation. The standard deviation is the square root of the variance. The population standard deviation is √663.9 ≈ 25.77 minutes, and the sample standard deviation is √796.7 ≈ 28.23 minutes.
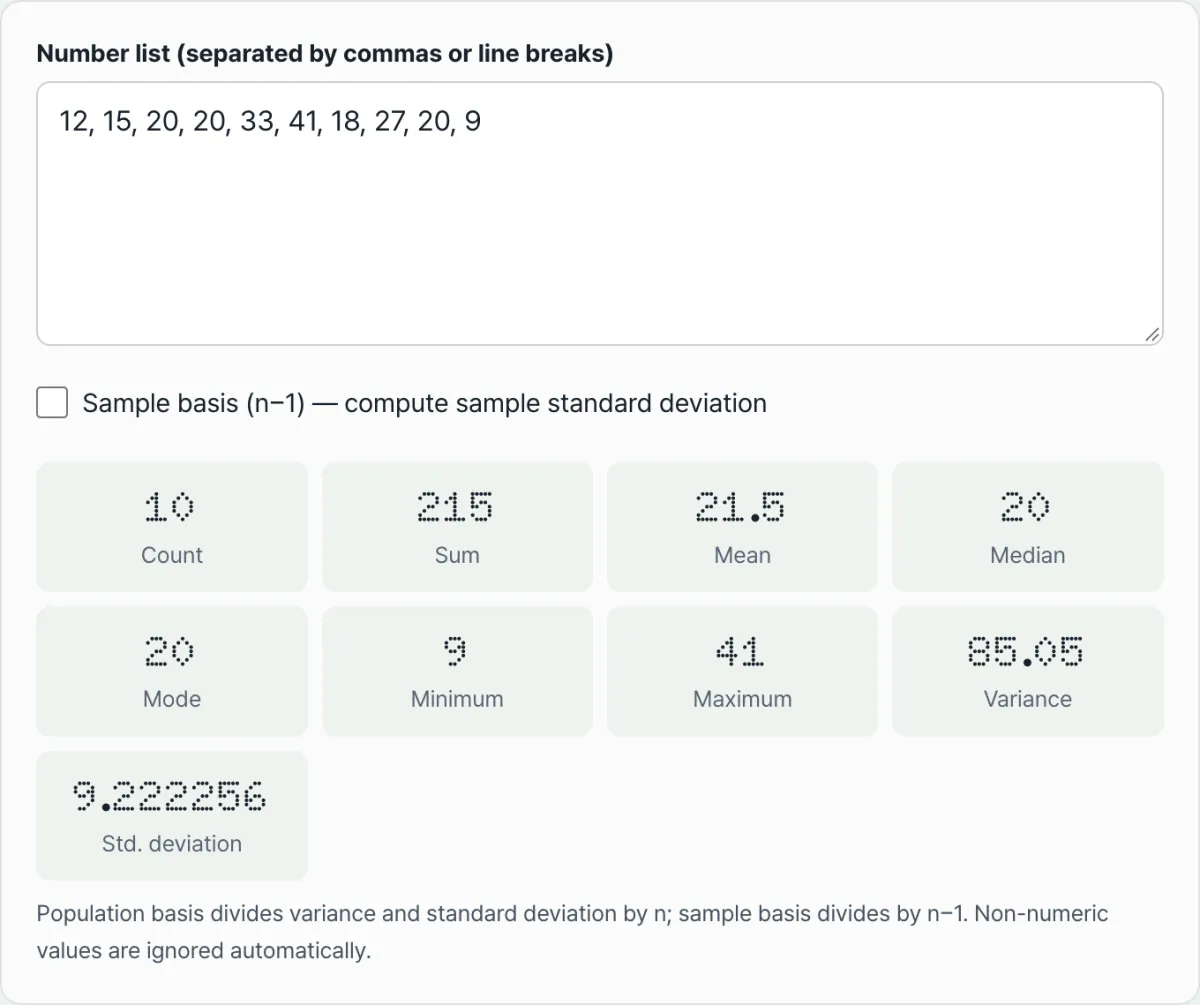
Instead of repeating those six steps by hand, you can paste in your list of numbers and see all of these values at once. Check it with our tool.
Paste a list of numbers and get the count, mean, median, mode, variance, and standard deviation right in your browser. Your data is never sent to a server.
Common Points of Confusion
The mean, median, and mode coming out different is not a calculation error. These three values summarize data in fundamentally different ways. The mean adds up every value and divides by the count, so a single extremely large or small value affects it. The median looks at the middle position after sorting, so the size of an extreme value doesn't matter. The mode only counts frequency.
Sometimes the mode comes out as "none." If every value you enter is different and appears only once, there's no way to pick a single most frequent value. On the other hand, if several values share the same highest frequency, all of them are shown.
The unit of variance differs from the unit of the original data. That's because squaring the deviations squares the units too (for data in minutes, the variance is in "minutes²"). The standard deviation takes the square root of the variance, which brings it back to the same unit as the original data.
n vs. n−1: Which Is Bigger?
Here's the difference between n and n−1 in a table.
| Type | Variance formula | Size with the same data |
|---|---|---|
| Population (n) | Sum of squared deviations ÷ n | Relatively smaller |
| Sample (n−1) | Sum of squared deviations ÷ (n−1) | Relatively larger |
Mathematically, the sample (n−1) variance is undefined when there's only 1 value, because the denominator becomes 0. In other words, when you have just one data point, this calculation doesn't work at all.
Recap
- The mean is total ÷ count, the median is the middle value after sorting (the average of the two middle values if the count is even), and the mode is the value that appears most often. Because the methods differ, the three values can differ even with the same data.
- Variance is the sum of the squared differences (deviations) between each value and the mean, divided by a count, and standard deviation is its square root.
- Depending on whether you divide by n (population) or n−1 (sample), the variance and standard deviation change, and the n−1 version is always greater than or equal to the n version.
- A single extreme value moves the mean a lot, while the median and mode move relatively little.
- The calculation runs in this order: count, total, sort, frequency, sum of squared deviations. Follow that order exactly and you can verify it by hand too.
Paste a list of numbers and get the count, mean, median, mode, variance, and standard deviation right in your browser. Your data is never sent to a server.
Frequently Asked Questions
How do the population and sample standard deviation formulas differ?
The calculation is the same up to the sum of squared deviations. Only the number you divide by changes. The population version divides by the count (n), and the sample version divides by the count minus one (n−1). The sample version, with the smaller divisor, always gives a variance and standard deviation greater than or equal to the population version.
Why does the mode come out as "none"?
If every number you enter is different and appears only once, there's no single most frequent value to pick, so it shows as "none." On the other hand, if several values tie for the highest frequency, all of them are shown.
Can I mix commas and line breaks in my input?
Yes. The text you enter is split on spaces and commas and then converted to numbers, so it works whether you separate values with commas, line breaks, or a mix of both. Anything that can't be converted to a number is left out of the calculation automatically.
Is my list of numbers stored on a server?
No. The count, mean, median, mode, variance, and standard deviation are all calculated right in your browser, and your list of numbers is never sent to or stored on a server.
This article was adapted from our Korean original. Read the Korean original