
Gantt Chart vs Calendar: Duration as Bars, Not Dots
Contents
A calendar marks a schedule as a "dot" in a single date box, so the length of the period stays invisible. A Gantt chart draws one bar from the start date to the end date, so you can see right away how many days a task runs and how many days it overlaps other tasks — just from where the bars sit. Here's why that difference exists, and how you can draw the same bar by hand with no tool at all, using the actual math.
Summary ① A calendar places a schedule as a "dot" in a single date cell, so the length of the period stays hidden, while a Gantt chart shows the start date through the end date as the length of a bar. ② Every task is drawn on the same timeline (one shared date axis), so when bars overlap, the schedules overlap — and you see that overlap just from the positions. ③ You can fill the bar with progress (%), so the same screen shows not only "by when" but "how far along it is right now."
A calendar can't show length or overlap
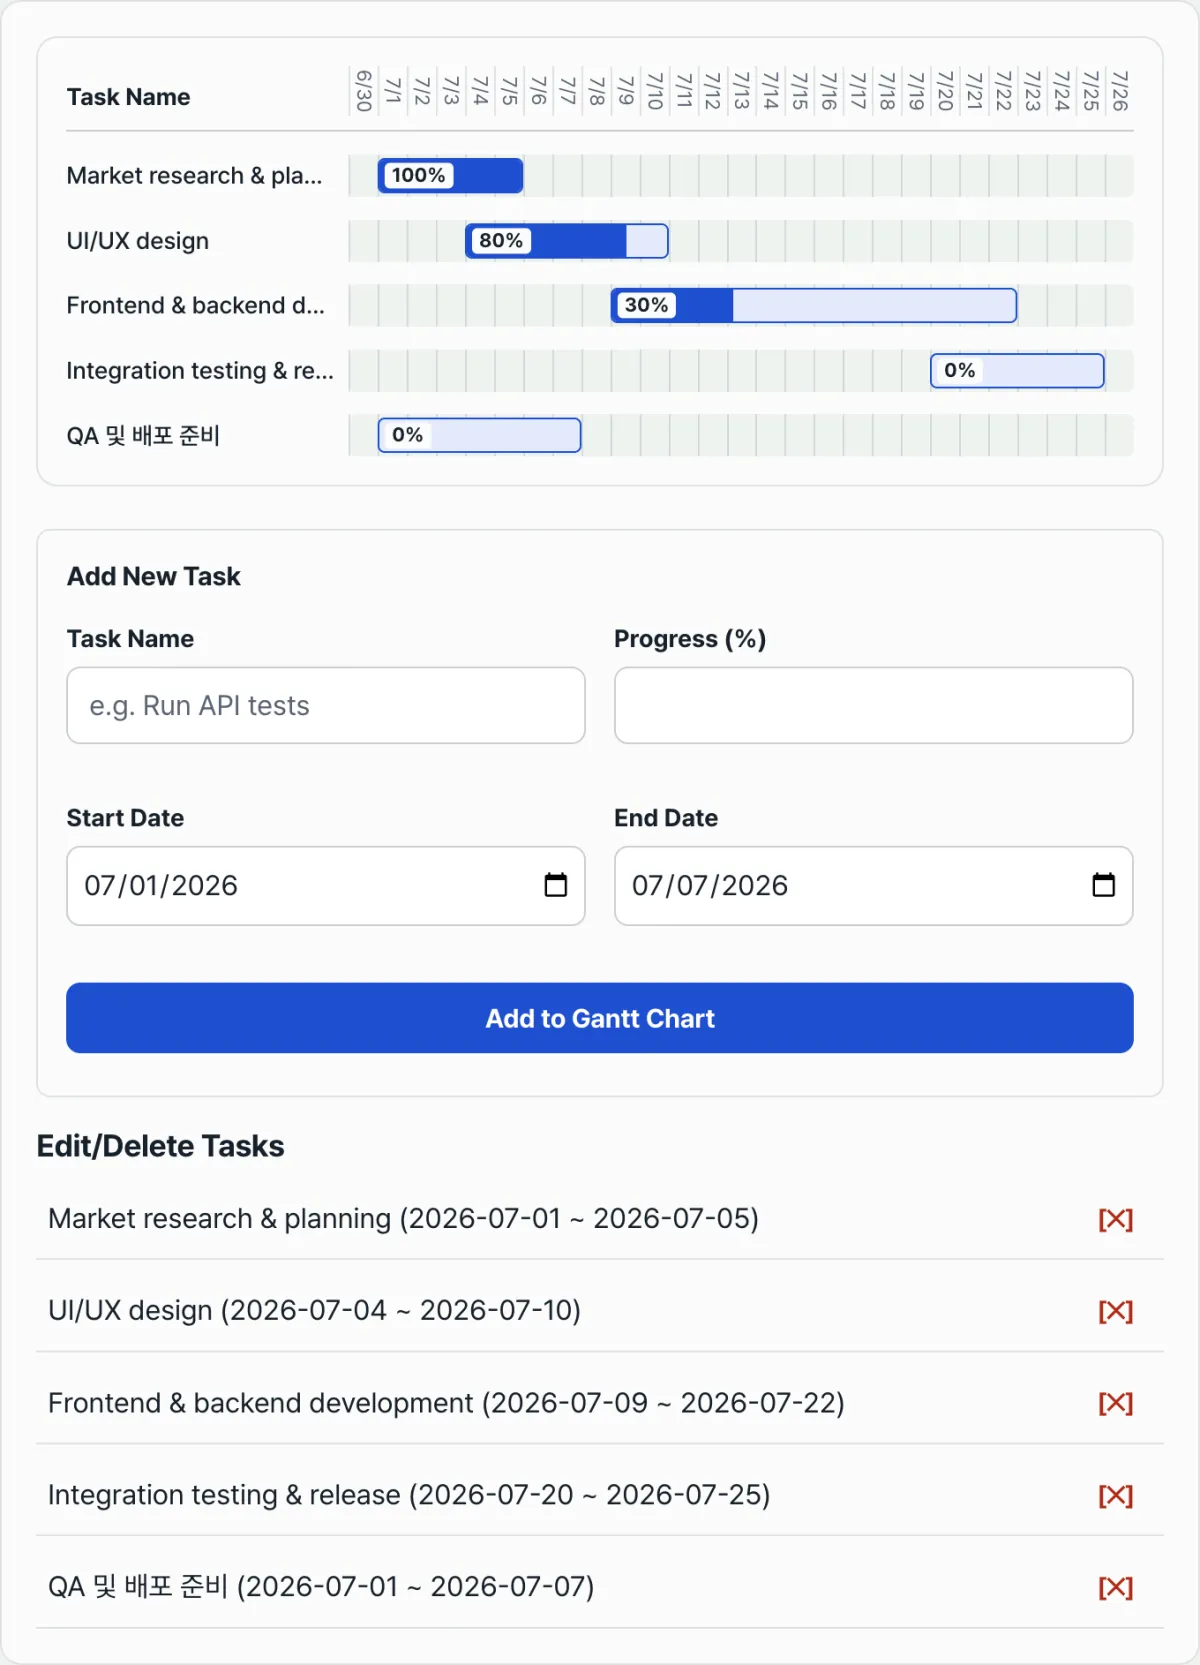
When you plan a project schedule, tasks often run for several days and overlap — "market research 7/1–7/5," "design 7/4–7/10," "development 7/9–7/22." Type those into a calendar app as they are and each one appears only as the one-day cell with the start date on it (or as an entry repeated every day).
So to answer "how many days does design overlap research?" or "how many days does development take in total?" you have to count dates one by one. And when a week wraps to a new row in the calendar (Sunday, then Monday on the next row), the same task looks broken up on screen, which makes the length even harder to read.
The calendar isn't wrong. A calendar is built to show what you're doing on a given day, not how long something lasts.
How a Gantt chart solves this (drawing it by hand)
A Gantt chart's bar positions and lengths come from five steps. Copy them onto paper or a spreadsheet and you can draw the same picture without any tool.
Setting the shared timeline and bar positions
Step 1 — Set the range of the shared timeline. Find the earliest start date and the latest end date across all tasks, then leave one day of padding on each side. For example, if the tasks fall between 7/1 and 7/25, the timeline runs from 6/30 to 7/26.
Step 2 — Divide the timeline into one-day cells. Make as many horizontal cells as there are total days, with each cell standing for one day. That becomes the Gantt chart's scale.
Step 3 — Find where the bar starts on the left. Take (task start date − timeline start date) in days and divide by the total number of days, and you get the percentage from the left where the bar begins.
Bar length and progress fill
Step 4 — Find the bar length (width). (task end date − task start date + 1 day) divided by the total days gives the bar width ratio. You add 1 because both the start date and the end date count as working days (7/1–7/5 is 5 days).
Step 5 — Fill the progress inside the bar. Fill only the progress (%) portion of the bar width in a darker shade. The bar length shows the planned period and the filled part shows actual progress, both in the same shape.
Draw it this way and two overlapping tasks show up immediately as a stretch where the bars' horizontal positions overlap. Information you'd have to count dates for in a calendar is done with one picture.
See it in our free tool.
Enter task names, start and end dates, and progress, and they show up as bars on the same timeline right away. Free to use, no login.
Common sticking points
| Situation | What happens |
|---|---|
| You add task after task without changing the start and end dates | Only the task name field clears; the start and end dates keep their previous values, so the next task gets added with the same dates |
| You enter a progress value above 100 or a negative number | It's automatically corrected to a value between 0 and 100 before it's added |
| You enter an end date earlier than the start date | The duration calculation goes negative and the bar may not display properly, so the end date should always come after the start date |
| You want to change only the progress of a task you already added | There's no per-item edit, so you have to delete it and add it again with the progress you want |
| You delete every task | The timeline loses its reference point and returns to the default state of just today |
The bottom line
- A calendar marks a schedule as a "dot" in a date cell; a Gantt chart draws a "bar" from start to end, so the length is visible at a glance.
- Bar position is (start date − timeline start date) / total days, and bar width is (end date − start date + 1) / total days.
- All tasks are drawn on the same timeline, so overlapping bars mean overlapping schedules.
- Filling the bar with progress (%) lets you see duration and progress on the same screen.
- The start and end date fields don't reset when you add a task, so change them yourself before entering the next one.
Enter task names, start and end dates, and progress, and they show up as bars on the same timeline right away. Free to use, no login.
Frequently asked questions
When should you use a Gantt chart and when should you use a calendar?
A calendar is built to show what you're doing on a given day, with schedules written into date cells, so it fits appointments and events that live on a single day. A Gantt chart is built to show how long a period lasts and whether it overlaps other schedules, using bars, so it fits project schedules where multiple tasks run for several days and overlap. The structure you pick depends on whether you're managing multi-day overlapping work or one-day events.
Do one-day tasks (start date = end date) still show as a bar?
Yes. Just enter the same date for the start and end. The width formula is (end date − start date + 1), so when the start and end dates match you get a short bar that's one day wide.
Is progress calculated automatically?
No. Progress isn't a calculated value — it's a number you type in between 0 and 100 when you add the task. There's no way to edit only the progress of a task you've already added, so when progress changes, delete that item and add it again with the new progress value.
This article was adapted from our Korean original. Read the Korean original