
JS Minifier Compression Rate: How It's Calculated
Contents
If you paste your JavaScript into a minification site and get 20% one time and 60% another, it's normal to wonder which number is right.
The minification rate (%) is just a number that compares the byte counts of your code before and after minifying. That number changes depending on whether the tool only strips whitespace and comments or also renames variables.
This post explains exactly what math produces that number, and why results differ from tool to tool, in a way you can verify yourself.
Summary ① The minification rate (%) is (1 − output bytes ÷ input bytes) × 100. It compares nothing but the text byte counts measured with Blob. ② A light minifier that only strips whitespace and comments doesn't do variable mangling or tree-shaking, so the same code that comes out small with Terser or UglifyJS will come out at a different size here. ③ Strings, template literals, and regex internals are left untouched, and for code that omits semicolons, it's safest to run the minified output and confirm the behavior.
Why the minification rate differs from tool to tool
If you run the same JS file through several minification sites one after another, some will report a rate in the 20s and others will go past 60%. Same file, different numbers — it's easy to suspect the math is wrong.
The cause isn't a calculation error. The tools simply do different work. Some only strip whitespace and comments. Others also do variable mangling and tree-shaking.
The more a tool does, the smaller the output code gets, and the higher the minification rate goes.
This tool is on the whitespace-and-comments-only end. So compared with a tool that shortens variable names, a lower rate from this tool is expected. Neither is better — they just do different jobs.
How to calculate and verify the rate yourself, without a tool
You can check whether the number is right without any tool. The definition is just a byte count comparison.
- Measure the original byte count. Open the console in your browser's developer tools and enter
new Blob([코드문자열]).sizeto see immediately how many bytes that string is. This value is your input bytes. - Remove comments and unnecessary whitespace by hand. Delete lines starting with
//and blocks wrapped in/* */, then join the remaining lines and indentation. Don't touch//or spaces inside strings, template literals, or regular expressions — those are data. - Measure the result the same way. Put your hand-minified string back into
new Blob([...]).size. This value is your output bytes. - Apply the formula as is. (1 − output bytes ÷ input bytes) × 100 is the minification rate (%). If your hand calculation matches what the tool shows, that tool is calculating the same way.
- Run the minified code to confirm it behaves like the original. In code that omits semicolons and relies on line breaks to separate statements (ASI-dependent code), removing the line breaks can glue separate statements onto one line. The way to check is to run the code before and after minifying and see whether you get the same result.
Once you've done this by hand, you'll know exactly what the rate measures. The catch is that the longer your code gets, the more tedious it is to repeat the job of stripping whitespace precisely while leaving strings, templates, and regex internals alone.
Check it with our tool.
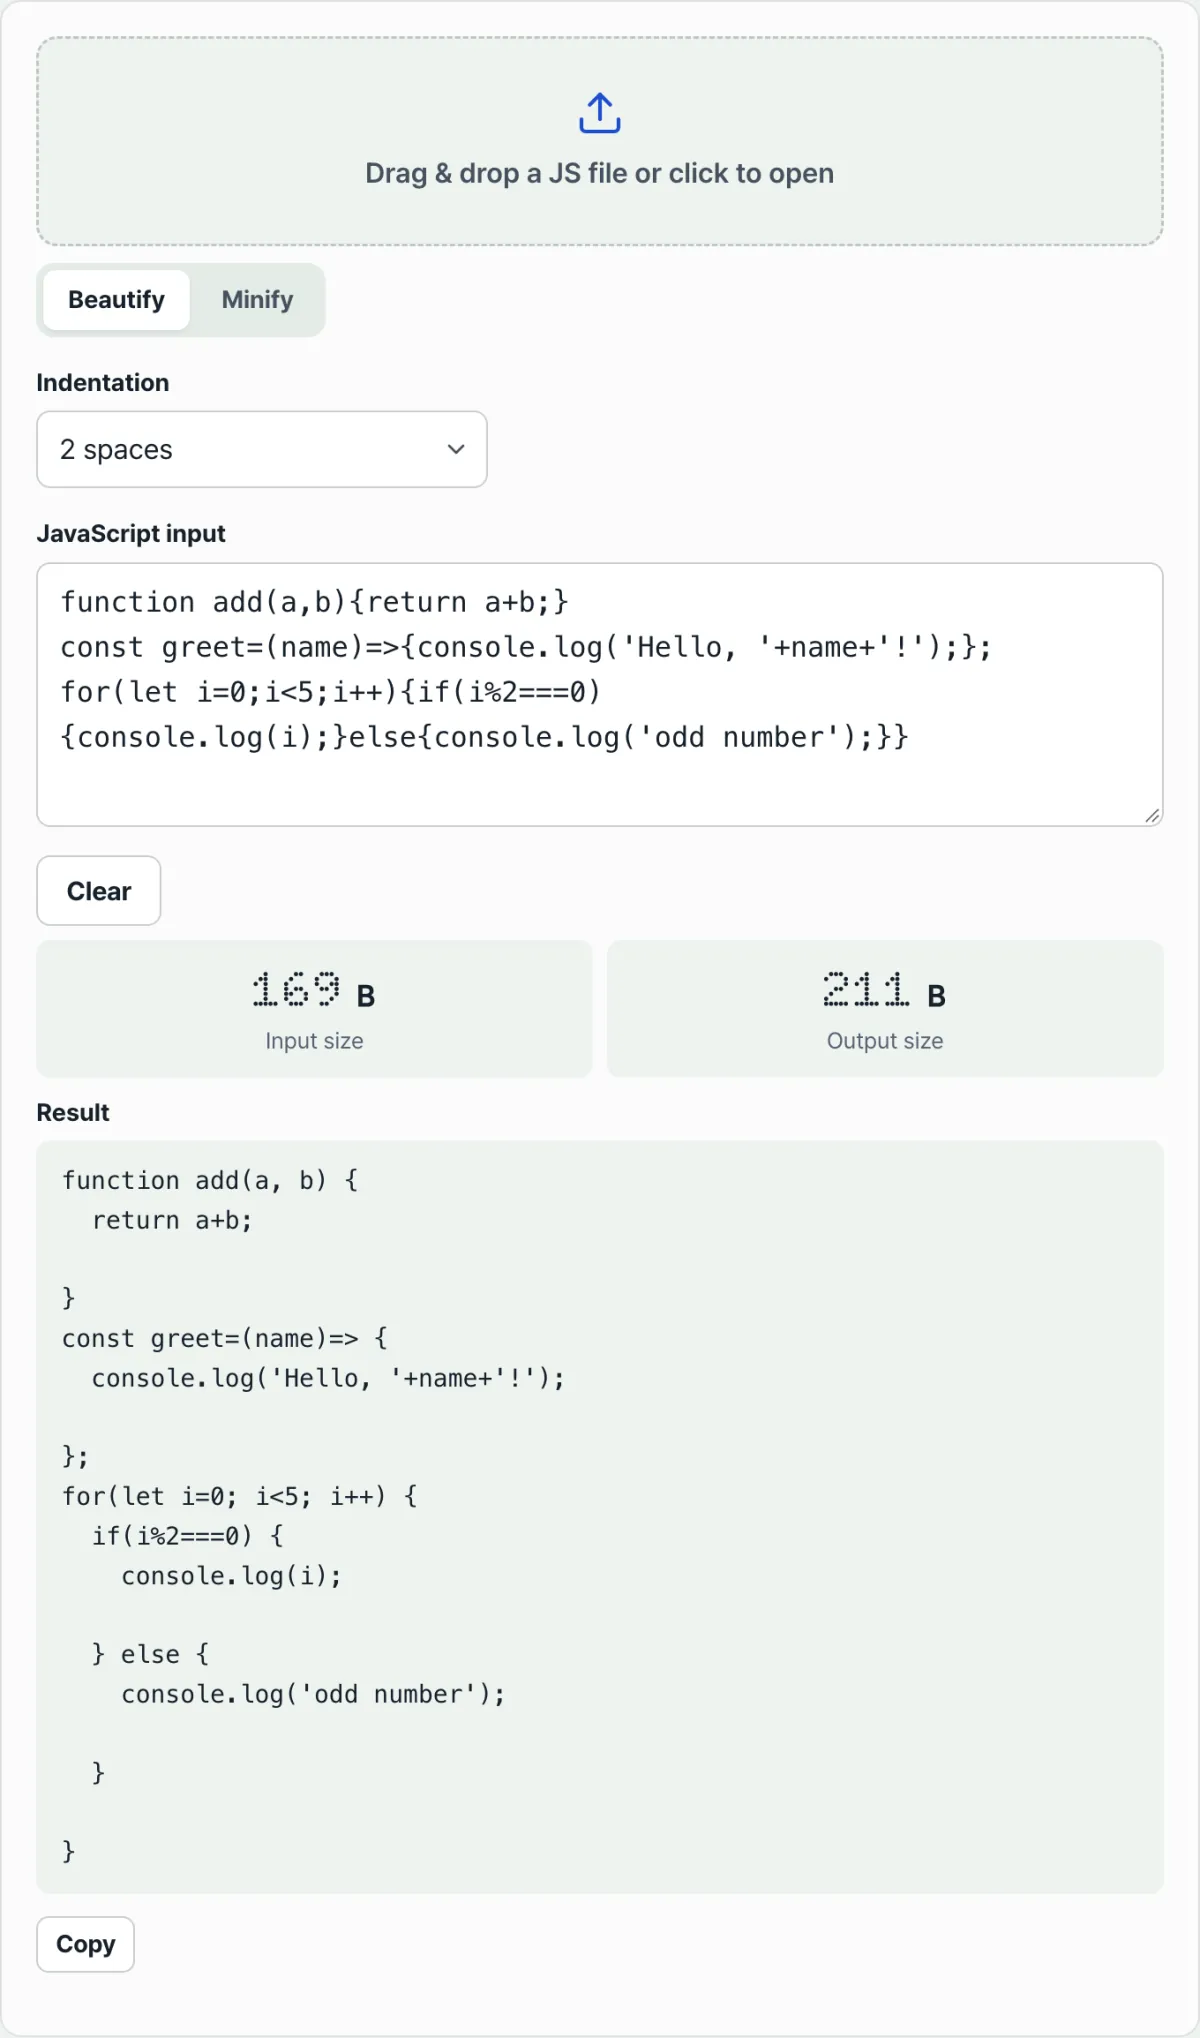
Minify and beautify right in your browser with no install or sign-up, and check the input and output byte counts and compression rate in real time.
Common points of confusion
The minification rate (%) is a different concept from image or font compression. What's being measured here is only the byte count of your JS text as a Blob size; it's not on the same basis as lossy or lossless compression of photos and fonts.
The rate only shows in Minify mode. Beautify mode adds line breaks and indentation to make code readable, so the byte count actually goes up — a "savings" figure doesn't make sense there.
Here's how a light minifier differs from a full-fledged one.
| Whitespace and comment stripping (this tool) | Terser / UglifyJS and similar | |
|---|---|---|
| Strips whitespace and comments | Yes | Yes |
| Variable mangling | No | Yes |
| Tree-shaking | No | Usually |
| Strings, templates, regex internals | Detected and preserved as is | Detected and preserved as is |
| Can you match original variable names in the output? | Yes | Usually not |
Regexes and division signs both use /. This tool isn't a full parser; it decides whether a / is a regex or division based on the keyword or operator before it, and it gets this right in most cases.
The takeaway
- The minification rate (%) is a text byte count comparison calculated as (1 − output bytes ÷ input bytes) × 100.
- It only shows in Minify mode, not in Beautify mode.
- A tool that strips only whitespace and comments doesn't do variable mangling or tree-shaking, so the output size differs from a full-fledged minifier.
- Strings, template literals, and regex internals are recognized separately and left alone.
- Before you deploy minified code, it's safest to run it and confirm it behaves like the original.
Minify and beautify right in your browser with no install or sign-up, and check the input and output byte counts and compression rate in real time.
FAQ
How exactly is the minification rate calculated?
Turn the input code and the output code into Blobs, get each byte count, then calculate (1 − output bytes ÷ input bytes) × 100.
It's based on bytes, not character count, so if Korean text or special characters are involved, a single character can take up multiple bytes.
Does it shorten variable names too?
No. This tool only does light minification at the level of stripping whitespace and comments. It doesn't do identifier mangling or tree-shaking, so you'll still see your original variable names in the output.
Can I deploy the minified code as is?
For most code, there's no problem. But if your code omits semicolons and relies on line breaks to separate statements, the line breaks disappear during minification and, in rare cases, the behavior can change.
After minifying, it's safest to actually run the output and confirm it behaves like the original.
Could the contents of strings or regexes get changed by mistake?
This tool distinguishes and recognizes double- or single-quoted strings, backtick template literals (including tracking nested ${...}), regex literals, and // and /* */ comments.
Nothing inside those sections is touched during minifying or beautifying — it's left as is.
This article was adapted from our Korean original. Read the Korean original