
P/E, P/B, and EV/EBITDA Formulas: How to Value a Stock
Contents
- The Formulas Behind the Three Valuation Metrics
- Where Multiples Fall Short Across Industries
- Check a Fair Stock Price with the Valuation Multiples Calculator
- Wrapping Up
- The Math Behind the Three Core Multiples
- Valuation Multiples Comparison Matrix
- 5 Costly Mistakes People Make in Valuation Analysis
- A 5-Step Institutional-Grade Valuation Workflow
- 7 Valuation Tips From the CFO's Playbook
- Decision Tree: Which Multiple Should You Use?
- Terminology Cheatsheet
- Frequently Asked Questions
The core of value investing, as taught by its founder Benjamin Graham and his famous student Warren Buffett, is simple: "Buy a stock for less than it's worth, then wait until the market pays full value."
But many new investors look only at the surface price. A stock that rose from ₩10,000 to ₩50,000 seems "too expensive," so they hesitate to buy. A ₩2,000 penny stock seems "cheap," so they jump in. Both reactions misread what a share price actually tells you. This article breaks down the math and interpretation behind three core financial filters that judge objectively whether a stock is cheap or expensive relative to the company's real worth: P/E, P/B, and EV/EBITDA.
Caution Investing and Company Valuation Disclaimer (Financial Disclaimer) The valuation multiples shown here are mechanical calculations based on past financial statements or the current market price. They are supplementary figures for a backward-looking valuation. They say nothing about a company's future growth, management risks such as embezzlement or breach of trust, disruptive shifts in an industry, or macroeconomic interest rate changes. Never use these figures as a recommendation to buy or sell a particular stock, or as a guarantee of returns. Before you commit real capital, complete your own business analysis and risk review.
Summary ① P/E (price-to-earnings ratio): Shows how many times a company's earnings (net income) the stock price represents. Calculate it as price ÷ earnings per share (EPS). ② P/B (price-to-book ratio): Measures the stock price as a multiple of the company's liquidation value (net assets). Calculate it as price ÷ book value per share (BPS). ③ EV/EBITDA: A cash flow metric that shows how many years of operating earnings (EBITDA) it would take to recover the company's value (EV). ④ With the Valuation Multiples Calculator (P/E, P/B, EV/EBITDA), you enter the stock price, share count, net income, and total equity. In about a second, you get all three core multiples and a guide to interpreting the relative valuation.
The Formulas Behind the Three Valuation Metrics
These three metrics look at a stock's price from three angles: the income statement (earnings), the balance sheet (assets), and the cash flow statement.
1. P/E (Price-to-Earnings Ratio)
This is the most widely used yardstick for comparing profitability.
- Formula: P/E = current stock price ÷ earnings per share (EPS) = market capitalization ÷ net income
- How to read it: A P/E of 10 means that if you saved the company's current net income for 10 years, you would reach the price of buying the whole company (its market cap). The lower a company's P/E is compared with its industry average or its competitors, the more likely it is classified as "undervalued relative to earnings."
2. P/B (Price-to-Book Ratio)
This yardstick measures book value, which shows the strength of a company's assets and acts as a safety net.
- Formula: P/B = current stock price ÷ book value per share (BPS) = market capitalization ÷ total equity
- How to read it: A P/B below 1.0 means the company's market cap is lower than the value (net assets) that would be left for shareholders if the company shut down all operations and liquidated its remaining assets. That marks an extreme undervaluation relative to liquidation value.
3. EV/EBITDA (Enterprise Value to EBITDA)
This yardstick measures cash-generating power with more precision for manufacturers and infrastructure companies. Heavy capital spending means large depreciation costs, which can distort net income.
- Formula: EV/EBITDA = enterprise value (EV) ÷ earnings before interest, taxes, depreciation, and amortization (EBITDA)
- (Here, EV = market capitalization + net debt)
- (Here, EBITDA = operating income + depreciation)
- How to read it: It works like a payback period. If you acquired the company, including its debt (net debt), it estimates how many years of operating cash flow you would need to earn back your investment. A lower number shows stronger cash generation relative to the stock price.
Where Multiples Fall Short Across Industries
If you apply valuation metrics mechanically to every company, you risk a serious misjudgment known as a value trap. Weigh each metric against the business characteristics of the industry.
- High-growth companies such as biotech and IT platforms: Net income is near zero or negative, so P/E can come out at 50, 100, or not measurable (N/A). If explosive future growth is credible (as measured by the PEG multiple), don't sell just because the stock looks expensive.
- Mature industries such as traditional manufacturing, finance, and construction: These industries have heavy equipment and steady growth, so they tend to trade at relatively low multiples. If you buy only because a number looks low, the stock can go sideways for years. Cross-check whether ROE (return on equity), a measure of capital efficiency, is declining.
Check a Fair Stock Price with the Valuation Multiples Calculator
Plugging in the stock price and financial statement figures, dividing by hand to get P/E, P/B, and EV/EBITDA, and then looking up whether each result means undervalued or overvalued gets tedious. Try the Valuation Multiples Calculator (P/E, P/B, EV/EBITDA).
Free · No sign-up · Enter financials to calculate all three valuation multiples instantly
The tool is simple to use.
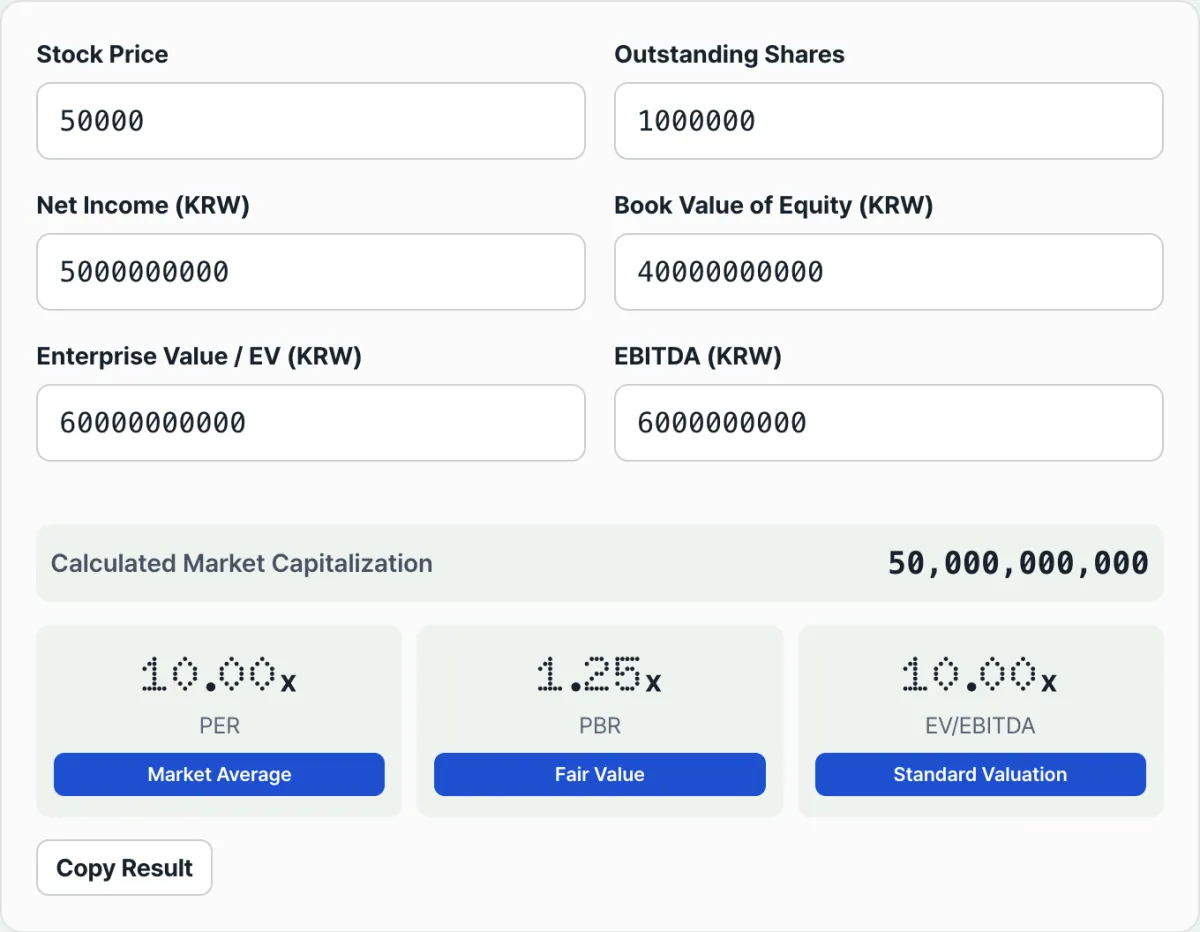
- Market price: Enter the current stock price and the number of shares outstanding. The tool calculates market capitalization automatically.
- Financial data: Enter net income and total equity (net assets) to see P/E and P/B.
- EV and EBITDA: Enter enterprise value (EV) and EBITDA yourself to see the EV/EBITDA multiple. The tool does not calculate EV or EBITDA from net debt or depreciation. Enter the EV and EBITDA values exactly as you find them in the financial statements or a brokerage research report.
- As soon as you enter the data, the dashboard report shows the P/E, P/B, and EV/EBITDA multiples for the company you're analyzing, precisely, in decimal form.
- Next to each metric, you also get an easy-to-follow valuation guide based on the current multiple (such as a possible undervalued quality stock, a fair price, or a growth-priced overvaluation), which helps build your financial knowledge.
Wrapping Up
Valuing a stock is the one essential survival tool in the rough seas of investing. Don't chase hot-theme stocks or rumors and get burned at the peak. Bookmark the Valuation Multiples Calculator (P/E, P/B, EV/EBITDA), and before you debate a stock, plug in the financial statement data to get honest multiples and build a scientific, reasonable margin of safety.
Free · No sign-up · Enter financials to calculate all three valuation multiples instantly
The Math Behind the Three Core Multiples
PER, PBR, and EV/EBITDA are the three pillars of company valuation. Each one checks a company's health from a different angle. Let's break down the math behind each one and what it means in finance.
1. P/E (Price-to-Earnings Ratio): The Profitability Yardstick
P/E is the metric most familiar to stock investors. It tells you how many years it would take to buy the whole company, based on the net income it earns today.
- Formula: PER = Stock Price/EPS = Market Capitalization/Net Income
- How it works: A P/E of 10x means that 10 years of current net income would add up to the stock price (the market cap). In other words, it would take 10 years to earn back your investment. If earnings are expected to grow fast, investors are willing to pay a high premium for the stock, so a high P/E can be justified. On the other hand, a company whose earnings are flat or shrinking tends to stay at a low P/E.
2. P/B (Price-to-Book Ratio) and the DuPont ROE Relationship: The Asset Soundness Yardstick
P/B shows how a stock's price compares with the company's net assets (total assets minus total liabilities).
- Formula: PBR = Stock Price/BPS = Market Capitalization/Total Equity
- DuPont Analysis and ROE: The real meaning of P/B shows up when you pair it with ROE (return on equity). PBR = PER × ROE (Here, ROE = Net Income/Total Equity)
- How it works: A P/B below 1.0 means that if you bought up all the shares on the market, liquidated the company, and split the net assets, you would come out ahead. But there is a catch. If a company's ROE stays below its cost of capital (usually around 8%), it isn't using capital efficiently and is destroying value. In that case, a P/B below 1.0 isn't "undervalued." It may simply be a fair market price.
3. EV/EBITDA (Enterprise Multiple): The Cash Generation and Capital Structure-Neutral Yardstick
EV/EBITDA values a company based on its core operating cash flow.
- Formula:
- EV (Enterprise Value): EV = Market Cap + Total Debt − Cash and Equivalents
- EBITDA (Earnings Before Interest, Taxes, Depreciation, and Amortization): EBITDA = Operating Income + D&A (Depreciation and Amortization)
- EV/EBITDA multiple: EV/EBITDA = EV/EBITDA
- How it works: To acquire a company outright, you don't just buy the stock (the market cap). You also take on the company's debt (total borrowings), and you can subtract the cash the company holds from the purchase price. That is the idea behind EV. Net income can be distorted by accounting costs such as depreciation, as well as by interest expense and taxes. So EBITDA adds those back to give you a view of pure operating cash flow. As a result, EV/EBITDA neutralizes differences in capital structure (more or less debt) and depreciation policy. That lets you compare the underlying earning power of companies more clearly.
Valuation Multiples Comparison Matrix
This matrix lets you compare the key features of each metric at a glance, so you can use the right one in the right situation.
| Metric | Financial Statement Source | Target Sector | Pros | Fatal Weaknesses | Safe Benchmarks |
|---|---|---|---|---|---|
| P/E | Income Statement | Consumer staples, services, financials, and most other sectors | Intuitive, widely used, and directly tied to earnings per share | Heavily distorted by one-time gains or losses, depreciation, and debt structure | At or below the sector average, or at the low end of its historical band (no absolute standard) |
| P/B | Balance Sheet | Financials (banks/brokerages), traditional manufacturing, utilities | Lets you check the downside floor of a company's asset (liquidation) value | Gap between book value and real asset value; intangible assets are poorly reflected | For asset-heavy stocks, P/B < 1.0 (but only if ROE > cost of capital) |
| EV/EBITDA | Cash Flow Statement, Income Statement | Semiconductors, telecom, airlines, energy (CAPEX-heavy industries) | Neutralizes distortions from capital structure and non-cash costs (depreciation); useful in M&A | Ignores non-operating income/expenses and equipment replacement costs, so it risks underestimating cash outflow | Generally, 8–10x or lower is considered undervalued (varies by industry) |
| EV/Sales | Income Statement | SaaS, biotech, platforms, and other high-growth companies running losses | Lets you value a company with revenue even when earnings are negative | Does not prove any ability to generate profit | Varies widely with industry growth rate and gross margin |
| PEG Ratio | Income Statement + future earnings estimates | IT growth stocks, tech, innovative companies | Builds earnings growth into P/E, easing the debate over overvalued growth stocks | Completely useless if the growth estimate is wrong | PEG < 1.0 is read as undervalued relative to growth |
Once you know this matrix, you can tell which multiple to reach for first, depending on the industry and the company you're analyzing.
5 Costly Mistakes People Make in Valuation Analysis
Most investors who fail in the stock market misuse valuation metrics in a superficial way. Watch out for these five common mistakes.
- Blindly trusting a low P/B without checking for ROE deterioration (the value trap): Say you bought a stock just because its P/B was 0.5x. If the company is stuck in years of losses and eating away at its capital (ROE < 0), its book value will melt over time. Even when P/B is low, check whether ROE is holding steady or rising. That's how you avoid a value trap.
- Misreading the lowest P/E at the peak for cyclical companies: For cyclical companies such as steel, chemicals, and shipping, earnings can explode in a boom, making the P/E look incredibly low at 2x or 3x. But that is the company's earnings peak. When the cycle turns, net income drops sharply and the stock price collapses. There's even a saying for cyclical stocks: "buy at a high P/E and sell at a low P/E." Earnings swing so much that you shouldn't rely on a simple P/E alone.
- Comparing P/E while ignoring debt: Suppose Company A (no borrowings) and Company B (debt ratio of 300%) both have a P/E of 10x. Company B, which is buried in debt and squeezed by interest expense, is actually much more expensive. To reflect the capital structure of the whole company, including debt, use EV/EBITDA as a supporting metric alongside P/E.
- Meaningless cross-industry multiple comparisons: It's nonsense to put a traditional shipbuilder (P/B 0.8, P/E 15) next to an innovative IT biotech healthcare company (P/B 8.0, P/E 80) and conclude that "the shipbuilder is much cheaper." The growth stage and profit margin structure of the two industries are completely different. Always compare multiples only within a peer group of similar companies.
- Mistaking a negative P/E for "cheap": When net income is a loss, P/E comes out negative or not calculable (N/A). Some people don't realize this and conclude the stock is cheap because no number shows up, or they simply drop the metric. In that case, use EV/Sales or check the downside with a P/B band.
A 5-Step Institutional-Grade Valuation Workflow
You don't need a Wall Street desk to analyze a company in a structured way. Here is a 5-step workflow you can follow on your own.
- Step 1 (Extract and clean the financial statement data): Download the last three years of audited reports (income statement, balance sheet, and cash flow statement) from your country's regulatory filing system, such as DART in Korea or SEC EDGAR in the US, or from a financial portal. Remove non-recurring items, such as a one-time gain from a property sale or a lawsuit settlement. What's left is the value of the core operations.
- Step 2 (Calculate the key multiples and run a DuPont breakdown): Using that data, calculate trailing (past 12 months) and forward (estimated next 12 months) P/E, P/B, and EV/EBITDA. At the same time, split ROE with a 3-step DuPont analysis (net profit margin × asset turnover × financial leverage). This shows whether profitability, efficiency, or leverage is driving ROE.
- Step 3 (Compare against peers and historical bands): Compare the multiples you calculated with the median of the peer group in the same industry. Then check the company's average multiple band over the past five years. This tells you whether the current price sits near the bottom or the top of that band.
- Step 4 (Check shareholder returns and capital allocation): Look at "Shareholder Yield," which combines the dividend yield with the share buyback and cancellation rate. A low multiple doesn't help if the company returns nothing to shareholders. The capital stays locked up and doesn't support the stock price.
- Step 5 (Build in a margin of safety and set a target price): Combine all the variables to estimate a theoretical fair price. Then subtract a 20–30% margin of safety to set a conservative buy target. Buy in installments only when the price falls below that target.
7 Valuation Tips From the CFO's Playbook
These are seven advanced tips that practitioners and chief financial officers (CFOs) use in mergers and acquisitions and when deciding on share buybacks.
- Never look at P/E alone (the power of PEG): A high P/E can be justified if earnings grow even faster. Always check PEG = PER/Earnings Growth Rate and see whether it is 1.0 or below. At 1.0 or below, the stock is cheap relative to its growth rate.
- When P/B is below 1.0, examine the quality of the assets under a microscope: No matter how low P/B is, the book assets may be a factory site in a remote area that can't be sold quickly, or obsolete inventory that will have to go at a steep discount. In that case, the real P/B is much higher. Read the footnotes to find out whether the company holds real cash-like assets and high-quality real estate.
- For capital-intensive industries, always put EV/EBITDA first: Semiconductor foundries, airlines, and telecom network operators spend trillions of won on equipment every year. Depreciation makes them look overvalued on P/E year after year. For these sectors, use EV/EBITDA to measure cash flow. That's when the real picture shows.
- The EBITDA trap: strip out non-operating one-time gains: When you calculate EBITDA, check whether proceeds from selling the headquarters building or gains from selling a subsidiary stake are included in operating income. They have nothing to do with the core business. If you don't remove them, EV/EBITDA drops artificially and the stock looks deeply undervalued when it isn't.
- Bet on forward (next 12 months) metrics, not trailing ones: Stocks live on the future. Trailing metrics are based on confirmed results from the past 12 months. Forward metrics add up brokerage consensus for the next 12 months. Tracking the rate of change (revisions) in forward metrics is more closely tied to stock returns.
- Don't trust operating cash flow (OCF) blindly. Look at free cash flow (FCF): A company can make money and still have nothing left for shareholders if it has to pour it all into equipment maintenance just to stay in place. Subtract capital expenditures (CAPEX) from operating cash flow, then check the market cap multiple based on that pure free cash flow (FCF).
- In the mobile era, make good use of web valuation tools: You don't have to open a trading terminal and run a spreadsheet each time. Bookmark the Valuation Multiples Calculator (P/E, P/B, EV/EBITDA) at the top of this post. You can then run a quick multiples check on the spot, whether you're on a company visit or reading breaking news.
Decision Tree: Which Multiple Should You Use?
The right yardstick depends on a company's lifecycle and industry. Follow this decision tree.
- Q1. Is the company currently profitable (positive net income)?
- [No] ➔ Early-stage startups with losses, biotech drug developers ➔ Use EV/Sales and the Rule of 40
- [Yes] ➔ Go to the next question (Q2)
- Q2. Is it an asset-heavy industry with big equipment investment and depreciation?
- [Yes] ➔ Semiconductors, steel, telecom, shipping, airlines ➔ Use EV/EBITDA
- [No] ➔ Go to the next question (Q3)
- Q3. Is it a traditional value stock with stable earnings and large asset value (real estate, cash)?
- [Yes] ➔ Banks, brokerages, insurers, holding companies, traditional asset-heavy stocks ➔ Use P/B (but always cross-check with ROE)
- [No] ➔ Go to the next question (Q4)
- Q4. Is it a stable consumer goods or services business that earns money from intangible assets and brand value, without heavy capital investment?
- [Yes] ➔ Food and beverage, franchises, entertainment, light manufacturing ➔ Use P/E and the PEG ratio
Keep this flowchart in your head. Whatever stock you come across, you can set up your analysis framework in a second.
Terminology Cheatsheet
This is a vocabulary list of valuation terms that everyone from beginners to experts should know.
- P/E (Price-to-Earnings Ratio): Market cap divided by net income for the period. It shows the price level relative to the company's earning power.
- P/B (Price-to-Book Ratio): Market cap divided by total shareholders' equity (net assets). It shows how many times book value the stock price is.
- EV/EBITDA (Enterprise Value to Earnings Before Interest, Taxes, Depreciation, and Amortization): Enterprise value (EV) divided by EBITDA, a proxy for operating cash flow. It works like the payback period if you acquired the company.
- EPS (Earnings Per Share): Net income earned in a year divided by total shares outstanding. It is the profit per share.
- BPS (Book-value Per Share): Net assets divided by shares outstanding. It is the book value per share.
- ROE (Return On Equity): The profit rate earned in a year using the money shareholders invested (equity). It is the ultimate measure of investment efficiency.
- Value Trap: A stock that looks extremely undervalued on the numbers but keeps losing value because its business competitiveness has eroded, so the price doesn't rise.
- PEG Ratio (Price Earnings to Growth Ratio): P/E divided by the EPS growth rate (%). It is a key complement for valuing growth stocks.
- Margin of Safety: The gap between a company's intrinsic value and its current market price. You buy when the price is well below intrinsic value, which acts as a buffer against risk.
Frequently Asked Questions
These Q&As dig into the dilemmas investors face in real markets.
Q1. If a stock's P/B is below 1.0 (0.4x, 0.5x, and so on), will it always recover to 1.0 and rebound? Why are so many stocks stuck as "cheap" for years?
A1. Short answer: no, never automatically. A P/B below 1.0 means investors believe the company can't earn even a bank's interest rate on the capital it holds. In other words, it is destroying capital. Say a company has 10 billion in capital and earns only 100 million a year (ROE of 1%). That's worse than putting the money in a bank deposit at 4%. A company like this stays stuck in the P/B 0.5x swamp (a value trap) unless it liquidates its assets or lifts ROE through a major shareholder return program, such as large dividends or share buyback cancellations. For the stock to rebound, a low number isn't enough. You need real momentum from an ROE turnaround.
Q2. Why do global private equity firms and institutions prefer EV/EBITDA over P/E in cross-border M&A?
A2. Corporate tax rates differ by country. Interest rate environments differ. And companies use very different depreciation periods and methods under their accounting standards (straight-line vs. declining-balance). Net income is heavily distorted by these differences in taxes, interest, and accounting treatment. EBITDA, on the other hand, is the company's pure operating cash-generating power before interest (I), taxes (T), and depreciation and amortization (D&A). It strips out the artificial accounting distortions between countries and between companies. EV/EBITDA also reflects a real-world fact of acquisitions: when you buy a company, you don't just buy the stock, you take on its debt too. Enterprise value (EV) captures that accurately. That's why it's used as the most transparent, intuitive measure of real value in the M&A market.
Q3. How do you value Silicon Valley AI stocks or platform growth stocks that haven't made a dime and lose hundreds of billions of won a year? Is valuation impossible for them?
A3. Even when a company is unprofitable and you can't calculate P/E, valuation methods still exist. The most common one is EV/Sales (enterprise value to revenue). If a company hasn't turned a profit yet but is capturing market share and growing revenue (the top line) explosively, the market prices in its expected future monopoly profits. You can also use the Rule of 40 mentioned earlier. It tests whether revenue growth rate plus profit margin (operating margin or free cash flow margin) adds up to more than 40%, which helps you spot high-quality growth stocks. More recently, venture capital (VC) valuation methods have become more sophisticated and are applied from many angles. These include valuing a company per MAU (monthly active user) and analyzing the ratio of customer acquisition cost (CAC) to customer lifetime value (LTV).
This article is based on general financial statement analysis under International Financial Reporting Standards (IFRS) and is written as an introductory aid for investing. Actual figures may differ depending on whether a listed company has special one-time non-operating losses.
What the Great Investors Teach Us About the Essence of Valuation
"In the short run, the market is a voting machine, but in the long run, it is a weighing machine." - Benjamin Graham Countless indicators flood the price screen every day and cloud your vision. But if you truly understand how the multiples that reflect a company's real value work, you can build a firm investment philosophy that short-term price swings won't shake. The P/E, P/B, EV/EBITDA, EV/Sales, and PEG ratios we've covered are not just products of simple math. They are the hard-nosed calculations of the smart money that has dominated global capital markets for decades. They are also the most powerful financial compass for finding a "rational balance point" amid the irrational prices created by human greed and fear.
This matters especially in markets like Korea's stock market (KOSPI, KOSDAQ). These markets have a high share of export-driven cyclical stocks, and governance issues lead to a discount against global markets (the Korea discount). In such markets, mechanically applying textbook P/E and P/B yardsticks is not enough to deliver great investment results. A true value investor looks past the flashy net income on the income statement. They look at the sustainability of earnings, the ability to generate free cash flow (FCF) on the cash flow statement, and management's commitment to efficient capital allocation and active shareholder returns (dividends, share buybacks, and cancellations).
While the crowd gets swept up in herd psychology, chasing theme stocks and surging stocks and speculating, a wise investor quietly opens DART (Korea's electronic disclosure system), reads the annual report closely, and runs a valuation model in Excel by hand. Or they check the company's fundamentals with a trustworthy web-based valuation tool. Measure the gap between fair price and current price, and pull the trigger only when you have a sufficient margin of safety. That discipline is the one secret that let legendary gurus like Warren Buffett and Peter Lynch survive a tough financial market and earn remarkable returns for decades.
Now you have a powerful weapon in your hands: the three core multiples, which help you avoid value traps and dig up hidden gems. Stop speculative trading based on hasty hunches or other people's recommendations. Take your first step down a calm, scientific path to investing, guided by data and quantitative indicators.
What the Great Investors Teach Us About the Essence of Valuation
"In the short run, the market is a voting machine, but in the long run, it is a weighing machine." - Benjamin Graham Countless indicators flood the price screen every day and cloud your vision. But if you truly understand how the multiples that reflect a company's real value work, you can build a firm investment philosophy that short-term price swings won't shake. The P/E, P/B, EV/EBITDA, EV/Sales, and PEG ratios we've covered are not just products of simple math. They are the hard-nosed calculations of the smart money that has dominated global capital markets for decades. They are also the most powerful financial compass for finding a "rational balance point" amid the irrational prices created by human greed and fear.
This matters especially in markets like Korea's stock market (KOSPI, KOSDAQ). These markets have a high share of export-driven cyclical stocks, and governance issues lead to a discount against global markets (the Korea discount). In such markets, mechanically applying textbook P/E and P/B yardsticks is not enough to deliver great investment results. A true value investor looks past the flashy net income on the income statement. They look at the sustainability of earnings, the ability to generate free cash flow (FCF) on the cash flow statement, and management's commitment to efficient capital allocation and active shareholder returns (dividends, share buybacks, and cancellations).
While the crowd gets swept up in herd psychology, chasing theme stocks and surging stocks and speculating, a wise investor quietly opens DART (Korea's electronic disclosure system), reads the annual report closely, and runs a valuation model in Excel by hand. Or they check the company's fundamentals with a trustworthy web-based valuation tool. Measure the gap between fair price and current price, and pull the trigger only when you have a sufficient margin of safety. That discipline is the one secret that let legendary gurus like Warren Buffett and Peter Lynch survive a tough financial market and earn remarkable returns for decades.
Now you have a powerful weapon in your hands: the three core multiples, which help you avoid value traps and dig up hidden gems. Stop speculative trading based on hasty hunches or other people's recommendations. Take your first step down a calm, scientific path to investing, guided by data and quantitative indicators.
What the Great Investors Teach Us About the Essence of Valuation
"In the short run, the market is a voting machine, but in the long run, it is a weighing machine." - Benjamin Graham Countless indicators flood the price screen every day and cloud your vision. But if you truly understand how the multiples that reflect a company's real value work, you can build a firm investment philosophy that short-term price swings won't shake. The P/E, P/B, EV/EBITDA, EV/Sales, and PEG ratios we've covered are not just products of simple math. They are the hard-nosed calculations of the smart money that has dominated global capital markets for decades. They are also the most powerful financial compass for finding a "rational balance point" amid the irrational prices created by human greed and fear.
This matters especially in markets like Korea's stock market (KOSPI, KOSDAQ). These markets have a high share of export-driven cyclical stocks, and governance issues lead to a discount against global markets (the Korea discount). In such markets, mechanically applying textbook P/E and P/B yardsticks is not enough to deliver great investment results. A true value investor looks past the flashy net income on the income statement. They look at the sustainability of earnings, the ability to generate free cash flow (FCF) on the cash flow statement, and management's commitment to efficient capital allocation and active shareholder returns (dividends, share buybacks, and cancellations).
While the crowd gets swept up in herd psychology, chasing theme stocks and surging stocks and speculating, a wise investor quietly opens DART (Korea's electronic disclosure system), reads the annual report closely, and runs a valuation model in Excel by hand. Or they check the company's fundamentals with a trustworthy web-based valuation tool. Measure the gap between fair price and current price, and pull the trigger only when you have a sufficient margin of safety. That discipline is the one secret that let legendary gurus like Warren Buffett and Peter Lynch survive a tough financial market and earn remarkable returns for decades.
Now you have a powerful weapon in your hands: the three core multiples, which help you avoid value traps and dig up hidden gems. Stop speculative trading based on hasty hunches or other people's recommendations. Take your first step down a calm, scientific path to investing, guided by data and quantitative indicators.
What the Great Investors Teach Us About the Essence of Valuation
"In the short run, the market is a voting machine, but in the long run, it is a weighing machine." - Benjamin Graham Countless indicators flood the price screen every day and cloud your vision. But if you truly understand how the multiples that reflect a company's real value work, you can build a firm investment philosophy that short-term price swings won't shake. The P/E, P/B, EV/EBITDA, EV/Sales, and PEG ratios we've covered are not just products of simple math. They are the hard-nosed calculations of the smart money that has dominated global capital markets for decades. They are also the most powerful financial compass for finding a "rational balance point" amid the irrational prices created by human greed and fear.
This matters especially in markets like Korea's stock market (KOSPI, KOSDAQ). These markets have a high share of export-driven cyclical stocks, and governance issues lead to a discount against global markets (the Korea discount). In such markets, mechanically applying textbook P/E and P/B yardsticks is not enough to deliver great investment results. A true value investor looks past the flashy net income on the income statement. They look at the sustainability of earnings, the ability to generate free cash flow (FCF) on the cash flow statement, and management's commitment to efficient capital allocation and active shareholder returns (dividends, share buybacks, and cancellations).
While the crowd gets swept up in herd psychology, chasing theme stocks and surging stocks and speculating, a wise investor quietly opens DART (Korea's electronic disclosure system), reads the annual report closely, and runs a valuation model in Excel by hand. Or they check the company's fundamentals with a trustworthy web-based valuation tool. Measure the gap between fair price and current price, and pull the trigger only when you have a sufficient margin of safety. That discipline is the one secret that let legendary gurus like Warren Buffett and Peter Lynch survive a tough financial market and earn remarkable returns for decades.
Now you have a powerful weapon in your hands: the three core multiples, which help you avoid value traps and dig up hidden gems. Stop speculative trading based on hasty hunches or other people's recommendations. Take your first step down a calm, scientific path to investing, guided by data and quantitative indicators.
What the Great Investors Teach Us About the Essence of Valuation
"In the short run, the market is a voting machine, but in the long run, it is a weighing machine." - Benjamin Graham Countless indicators flood the price screen every day and cloud your vision. But if you truly understand how the multiples that reflect a company's real value work, you can build a firm investment philosophy that short-term price swings won't shake. The P/E, P/B, EV/EBITDA, EV/Sales, and PEG ratios we've covered are not just products of simple math. They are the hard-nosed calculations of the smart money that has dominated global capital markets for decades. They are also the most powerful financial compass for finding a "rational balance point" amid the irrational prices created by human greed and fear.
This matters especially in markets like Korea's stock market (KOSPI, KOSDAQ). These markets have a high share of export-driven cyclical stocks, and governance issues lead to a discount against global markets (the Korea discount). In such markets, mechanically applying textbook P/E and P/B yardsticks is not enough to deliver great investment results. A true value investor looks past the flashy net income on the income statement. They look at the sustainability of earnings, the ability to generate free cash flow (FCF) on the cash flow statement, and management's commitment to efficient capital allocation and active shareholder returns (dividends, share buybacks, and cancellations).
While the crowd gets swept up in herd psychology, chasing theme stocks and surging stocks and speculating, a wise investor quietly opens DART (Korea's electronic disclosure system), reads the annual report closely, and runs a valuation model in Excel by hand. Or they check the company's fundamentals with a trustworthy web-based valuation tool. Measure the gap between fair price and current price, and pull the trigger only when you have a sufficient margin of safety. That discipline is the one secret that let legendary gurus like Warren Buffett and Peter Lynch survive a tough financial market and earn remarkable returns for decades.
Now you have a powerful weapon in your hands: the three core multiples, which help you avoid value traps and dig up hidden gems. Stop speculative trading based on hasty hunches or other people's recommendations. Take your first step down a calm, scientific path to investing, guided by data and quantitative indicators.
This article was adapted from our Korean original. Read the Korean original