
SVG Path Coordinates Extractor: How to Read d Attribute Numbers
Contents
If you've tried to move an SVG icon into Canvas, a game engine, or an animation library and the <path> tag's d="M10 10 L20 20 C..." string looked like a cipher, let me start with the answer. That string is just a repeating pattern of command letters and numeric coordinates.
Once you know the rules, you can pull the coordinates by hand, and this converter turns those repeating rules into code and organizes them into three formats: JSON, a point list, and CSV. That said, there are a few places where the results are easy to misread, and I'll cover those along with the calculation process.
Summary ① The
dattribute represents coordinates with command letters such as M (move), L (line), C (curve), and Z (close), followed by numbers. ② This tool treats letters as commands and groups the remaining numbers into x and y pairs, then outputs JSON, points, or CSV. ③ Uppercase letters mean absolute coordinates, and lowercase letters mean relative coordinates. For C curves, control points are also captured as coordinates.
When You Get a Whole d Attribute at Once
Suppose you copy just one <path d="..."> line from an SVG icon a designer gave you. To draw it exactly the same on an HTML <canvas>, turn it into a vertex array for Three.js, or put it into a motion library as keyframe coordinates, what you need in the end is a list of numeric coordinates.
The problem is that the d attribute isn't organized for human readability. In something like M10,10L20,20C30,30 40,30 50,20Z, the spacing is uneven and the commands are stuck to the numbers, so it's hard to count where one coordinate ends by eye.
On top of that, a single icon often contains dozens or hundreds of coordinates. Reading them all by hand is the problem this article addresses.
First, How to Read a d Attribute Without a Tool
The syntax of the d attribute is simple. When one letter (a command) appears, a new command starts, and the numbers after it are that command's values. Each command takes a fixed number of numbers.
M x y— Move the pen to (x, y) (moves only the starting point without drawing a line)L x y— Draw a straight line from the current point to (x, y)H x— Horizontal line (only one x value)V y— Vertical line (only one y value)C x1 y1 x2 y2 x y— Cubic Bézier curve (2 control points + endpoint)Z— Close the path by returning to the starting point (no numbers)
Here's the most important rule. Uppercase letters are absolute coordinates, and lowercase letters are relative coordinates. L20 20 means "to (20,20) based on the SVG origin (0,0 at the top left)," while l20 20 means "20 to the right and 20 down from the current point." Even with the same numbers, changing only the letter puts you in a completely different place.
Let's read the basic example M10,10 L20,20 C30,30 40,30 50,20 Z by hand.
M10,10→ Move the pen to (10, 10)L20,20→ Straight line from (10,10) to (20,20)C30,30 40,30 50,20→ Curve. Control point 1 = (30,30), control point 2 = (40,30), endpoint = (50,20)Z→ Close back to the starting point (10,10)
The only point the curve actually passes through is the endpoint (50,20). (30,30) and (40,30) are just "handles" that bend the curve; the drawing doesn't pass through them. This distinction becomes key when you read the results later.
If you know only how many numbers each command takes (M/L = 2, H/V = 1, C = 6, Z = 0), you can break any d attribute into coordinates by hand. But with hundreds of coordinates, doing it by hand gets exhausting, and mistakes creep in.
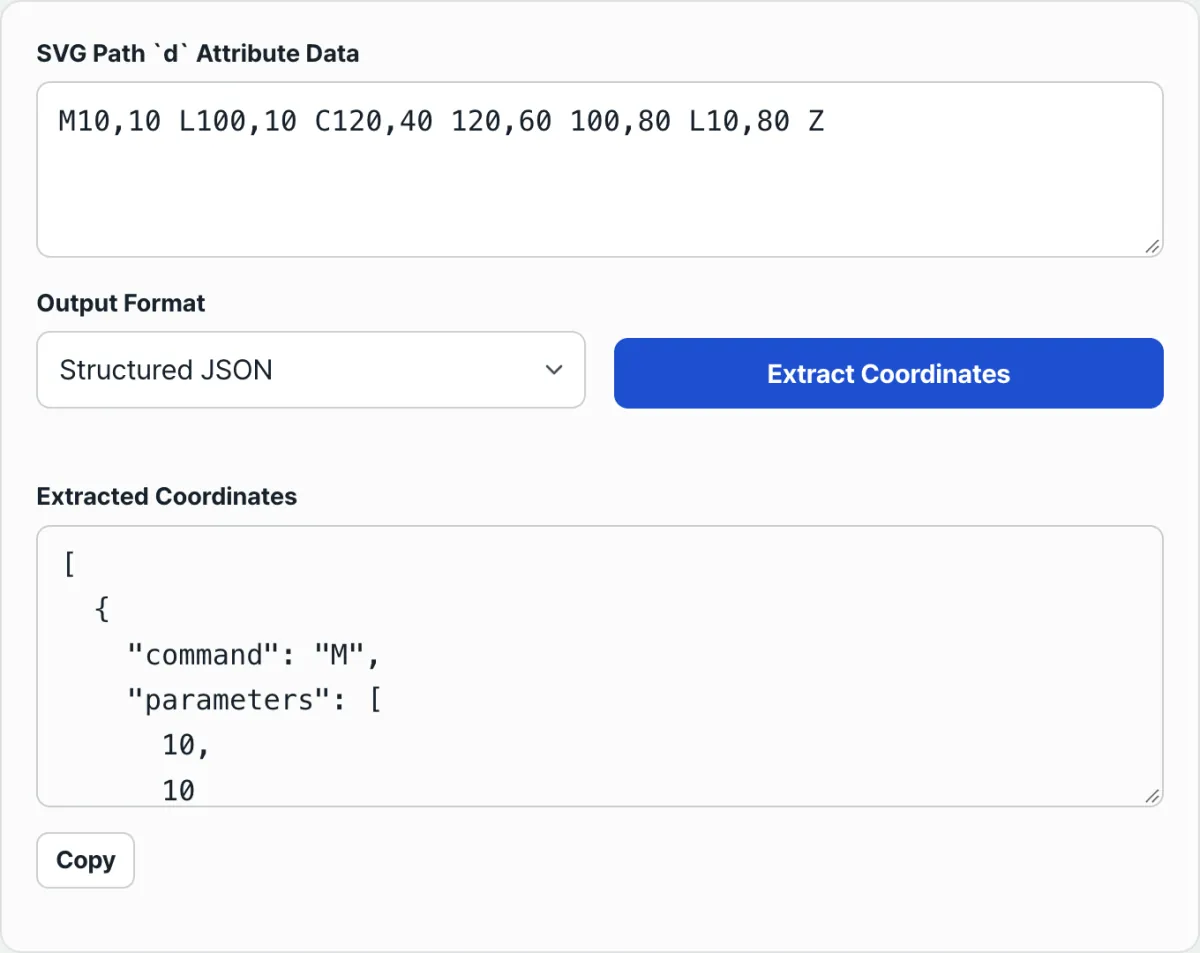
Try it with our tool.
Runs in your browser with no install or login. The d attribute you enter is never sent to a server — it's converted to JSON, points, and CSV right there.
How This Tool Extracts the Numbers
This converter does exactly what you just did by hand, but in code. It doesn't send anything to a server; it processes everything inside your browser. Here's the sequence.
Step 1 — Split by command. It breaks the input d string into chunks of "one letter + the numbers that follow." So M10,10 L20,20 C... Z splits into four chunks: an M chunk, an L chunk, a C chunk, and a Z chunk.
Step 2 — Separate letters from numbers. It takes the first letter of each chunk as the command and splits the rest of the string on spaces and commas into an array of numbers. If a negative number is attached, as in 10-20, it inserts a space before it and splits it into 10 -20.
Step 3 — Output in the format you choose. There are three formats, and results appear only after you press the 'Extract Coordinates' button. Changing the input alone won't refresh them automatically.
Structured JSON — Holds the commands and parameters as-is.
[
  { "command": "M", "parameters": [10, 10] },
  { "command": "L", "parameters": [20, 20] },
  { "command": "C", "parameters": [30, 30, 40, 30, 50, 20] },
  { "command": "Z", "parameters": [] }
]
X, Y Point List — Pairs each command's numbers two at a time and flattens them into coordinate pairs.
[
  { "x": 10, "y": 10, "cmd": "M" },
  { "x": 20, "y": 20, "cmd": "L" },
  { "x": 30, "y": 30, "cmd": "C" },
  { "x": 40, "y": 30, "cmd": "C" },
  { "x": 50, "y": 20, "cmd": "C" }
]
CSV Table — Outputs a Command,X,Y table.
Command,X,Y
M,10,10
L,20,20
C,30,30
C,40,30
C,50,20
Z,,
Put the three formats side by side and the rule becomes clear. JSON shows all the numbers for each command as a group, while the point list and CSV always pair those numbers into x and y, two at a time. This "pairing by two" is convenient, but it's also the source of the confusion you'll see below.
Common Ways to Misread the Results
First, the control points of a curve are also captured as coordinates. In the point list above, all three pairs — (30,30), (40,30), and (50,20) — come out as coordinates for the C command. But as we saw earlier, only (50,20) is actually on the drawing; the first two are control points. If you use all of them as points the path passes through, you'll get the wrong shape instead of the curve.
Second, commands with a single number land in the wrong column. Because the tool always fills numbers starting with x, the 80 in V80 (vertical line) is actually a y value, but in CSV it goes in the X column and the Y column is left blank. In the point list, it's left out entirely because it has no pair.
Third, uppercase and lowercase are preserved as-is, but they are not converted into positions. The tool keeps the original letter in cmd (whether it's M or m), but it doesn't convert lowercase (relative) coordinates into absolute coordinates. You have to account for the fact that the numbers in a lowercase command are offsets from the previous point.
| Command | Number of values | Meaning | What it looks like in the results |
|---|---|---|---|
| M / L | 2 | Move / straight line | An x, y pair exactly as-is |
| H | 1 (x) | Horizontal line | CSV fills only X, leaves Y blank, and it's not in the point list |
| V | 1 (y) | Vertical line | Same as above, but the value (y) goes in the X column |
| C | 6 | Curve | 2 control points + endpoint, all three pairs captured as coordinates |
| Z | 0 | Close | JSON has an empty array, CSV has an empty Z,, row, and the point list omits it |
For reference, A (arc) uses seven numbers (two radii, rotation angle, two flags, and the endpoint's x and y). This tool also pairs them two at a time, so radii and flags get mixed in as if they were coordinates. If a path contains A or Q, you need to check what each number means separately.
How to verify the coordinates yourself
If you're not sure the coordinates you pulled are right, the surest way is to work backwards and compare them to the drawing. There are two methods.
Draw the d you entered as-is. Put the same string into <svg><path d="..."/></svg> and open it in a browser, or paste it into a path visualization tool, and you'll see the actual shape. Compare the endpoint coordinates you extracted against the corners in the drawing by eye.
Plot the coordinates on paper or a graph. Plot the x and y values from the point list on a coordinate plane, but remember that in SVG, the y-axis increases downward. The top-left is (0,0), so it's flipped vertically compared to the coordinates you learned in math class. Miss this, and you'll think "the coordinates are right but the shape is upside down."
Summary
- The
dattribute is a repeating pattern of "command letter + numbers." The letter starts a command, and the number count is fixed for each command (M·L=2, H·V=1, C=6, Z=0). - Uppercase letters mean absolute coordinates; lowercase mean relative. This tool only preserves the letters — it doesn't convert relative to absolute.
- There are three outputs: JSON (numbers per command), a point list, and CSV (both, two numbers each for x and y). They only appear after you press the "Extract Coordinates" button.
- Because it pairs numbers up two at a time no matter what, C's control points also get captured as coordinates, and commands with different counts like H·V·Z·A can end up misaligned or missing.
- If you're unsure, draw the same
dand compare, keeping in mind that SVG's y-axis increases downward.
Runs in your browser with no install or login. The d attribute you enter is never sent to a server — it's converted to JSON, points, and CSV right there.
Frequently Asked Questions
Can I get only the on-curve points and skip the control points of a curve (C)?
The tool itself doesn't filter them out. Because it pairs all six numbers of a C command into three coordinates, you get the two control points and the one endpoint together. If you only need the on-curve points, just take the last pair (the endpoint) of each C command from the output. If you export in the structured JSON format, the numbers are grouped by command, so it's easy to grab the last two.
What happens if lowercase commands (relative coordinates) are mixed in?
The numbers come out unchanged, but the values aren't "absolute positions" — they're offsets from the previous point. The tool simply preserves the lowercase letters in the cmd field and doesn't convert them to absolute coordinates. If you need absolute positions, you have to add each relative coordinate to the previous point, in order.
Is the d attribute I enter sent to a server?
No, it isn't. All parsing happens inside your browser, with no server communication and no personal data collection. That's why you can use it right away with no login or install.
The result doesn't change.
After you edit the d string, you have to press the "Extract Coordinates" button again. Changing the input alone won't refresh it automatically.
This article was adapted from our Korean original. Read the Korean original